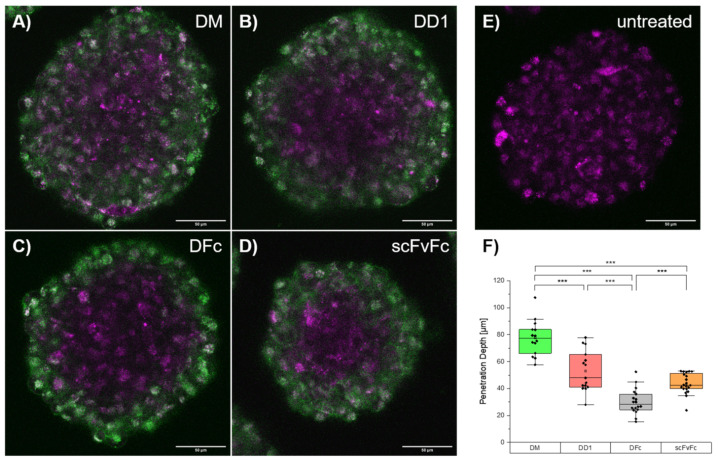
Figure 4.
Penetration depth of dye-conjugates in cell spheroids. Patient derived BT12 glioblastoma cells were incubated with 100 nM Alexa Fluor 647-labeled (A) DM, (B) DD1, (C) DFc or (D) scFvFc dye-conjugates (green) for 30 min, washed, and imaged after one to two hours at 37 °C. Lysosomes (magenta) were stained using LysoTracker Red DND-99. (E) Reference spheroids were solely treated with LysoTracker. (F) To determine the penetration depth for each dye-conjugate fluorescence profiles of Alexa Fluor 647 signals were plotted for each cell sphere (n = 5 per dye-conjugate) using Fiji ImageJ 1.52p. Penetration depth is defined as distance in µm of fluorescence signal calculated from profile plot. The two-sample t-test of Behrens-Fisher-test with a p < 0.05 level of significance was used to estimate statistical significance between categories (p < 0.001: ***).

