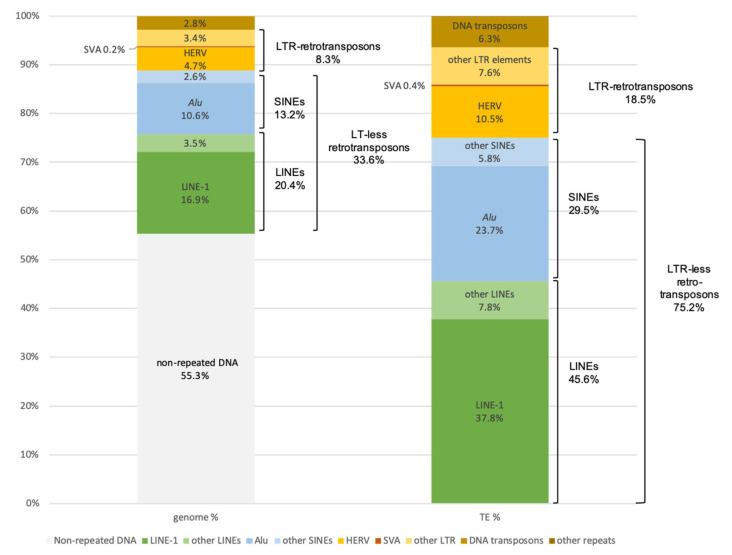
Figure 1.
Proportions of transposable elements (TEs) in the human genome and their distribution in different families and subfamilies. Left panel: the percentage of each class or subclass of TEs is indicated with respect to the whole genome according to data from [1]. Right panel: the distribution of TEs in each category is given as a percentage of the total TEs present in the genome according to [1].

