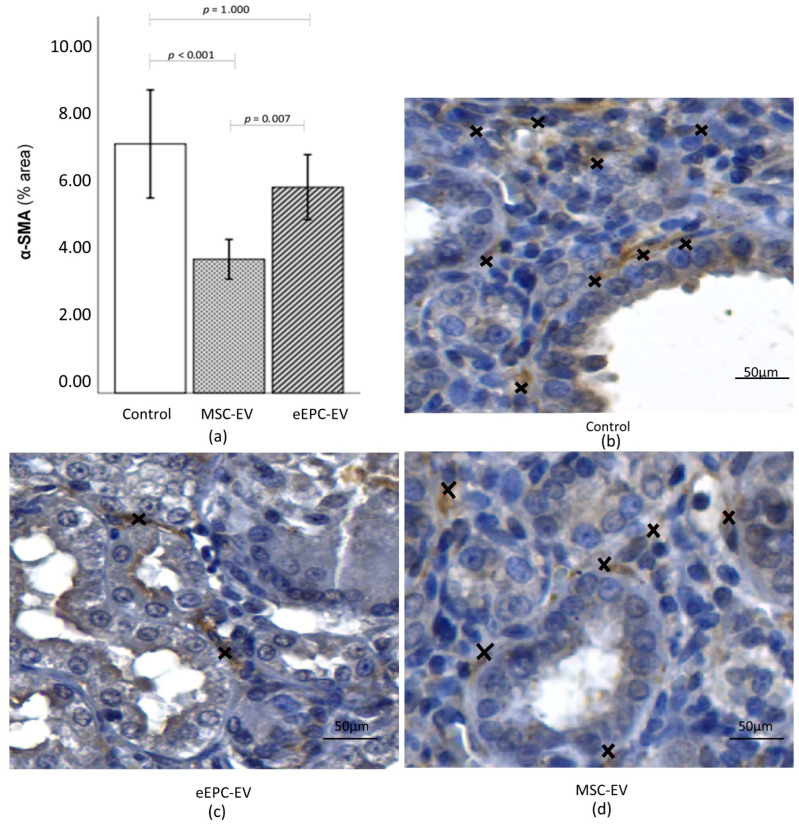
Figure 8.
Immunohistochemical staining of α-SMA. (a) There was a significant difference in the expression of α-SMA when comparing the C Group and the MSC-EV group (p < 0.001) and MSC-EV and the eEPC-EV group (p = 0.007). The data in figure are the mean ± sd. p < 0.05 is considered significant. (b–d) α-SMA expression (x) in (b) (Group C) was higher than that observed in (c,d) (groups eEPC-EV and MSC-EV, respectively).

