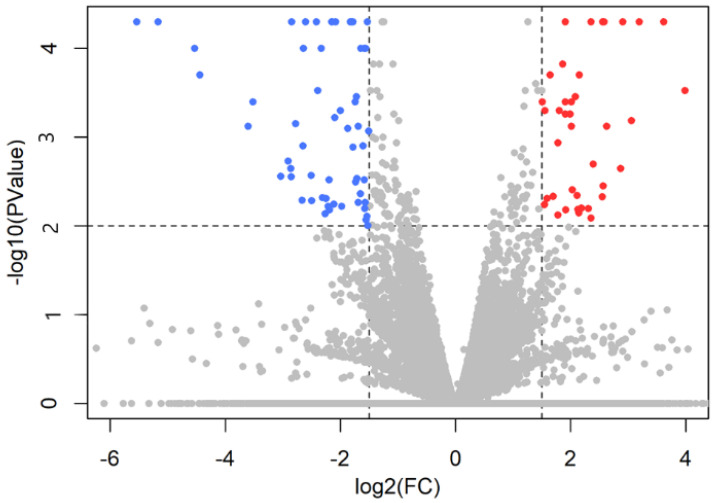
Figure 1.
The results of sequencing shown in a volcano plot. Significantly upregulated genes are red in the upper right corner, while significantly downregulated genes are blue in the upper left corner. Because the test is now based on explicit sampling from the beta negative binomial in Cuffdiff v.2.2.1., users do not see values less than 10−5 by default.

