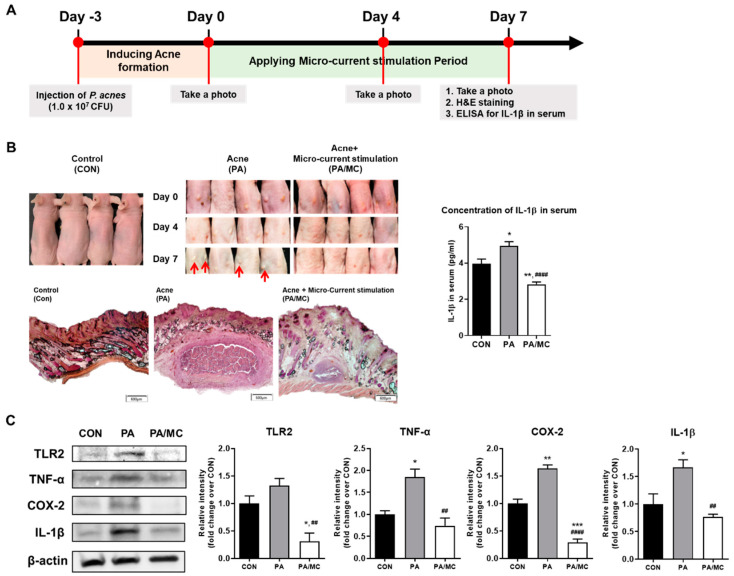
Figure 3.
(A) Schematic diagram indicating the timeline for animal experiments. (B) Photographs of dorsal skin were taken at days zero, four, and seven in control (CON), P. acnes-injected mice (PA) used as a positive control, and P. acnes-injected mice applied MC with the intensity of 50 μA group (PA/MC). Longitudinal sections of the individual lesions for each group by H&E staining on day seven. Also, ELISA analysis was conducted to measure serum IL-1β contributing to the development of inflammatory papules, pustules, and nodules in acne. (C) Immunoblot analysis of TLR2 and pro-inflammatory cytokines or mediators on the tissue of acne lesions. The tissue lysate was analyzed by immunoblot using TLR2, TNF-α, COX-2, and IL-1β antibodies. * p < 0.05, ** p < 0.01, *** p < 0.001, vs. control group. ## p < 0.01, #### p < 0.0001 vs. positive control.

