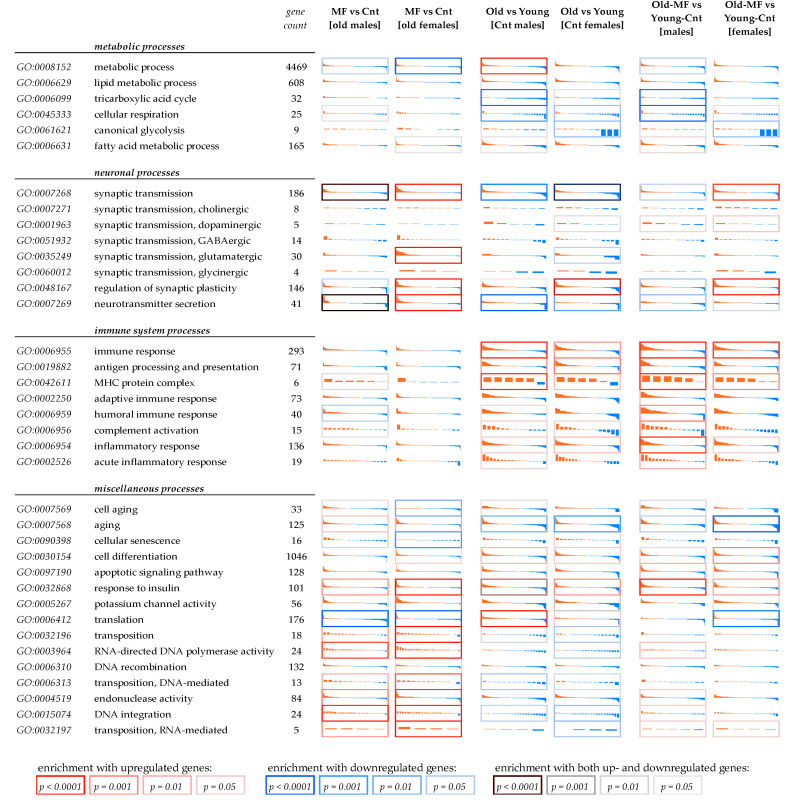
Figure 2.
Differential expression profiles of genes involved in various biological processes mostly affected either during aging or meclofenoxate treatment. Each cell demonstrates differential expression profiles for genes involved in a current GO biological process, either upregulated (red) or downregulated (blue) in (MF) fish with lifetime meclofenoxate-containing food supplement as compared with control (Cnt) fish, or in 12-month fish as compared with 3-month fish. Relative expression values are log2-transformed. Vertical axis range (in each cell) is from −2 (i.e., 4-fold expression increase) to +2 (i.e., 4-fold expression decrease). Genes are sorted according to LogFC. Cell borders indicate enrichment test results significance.

