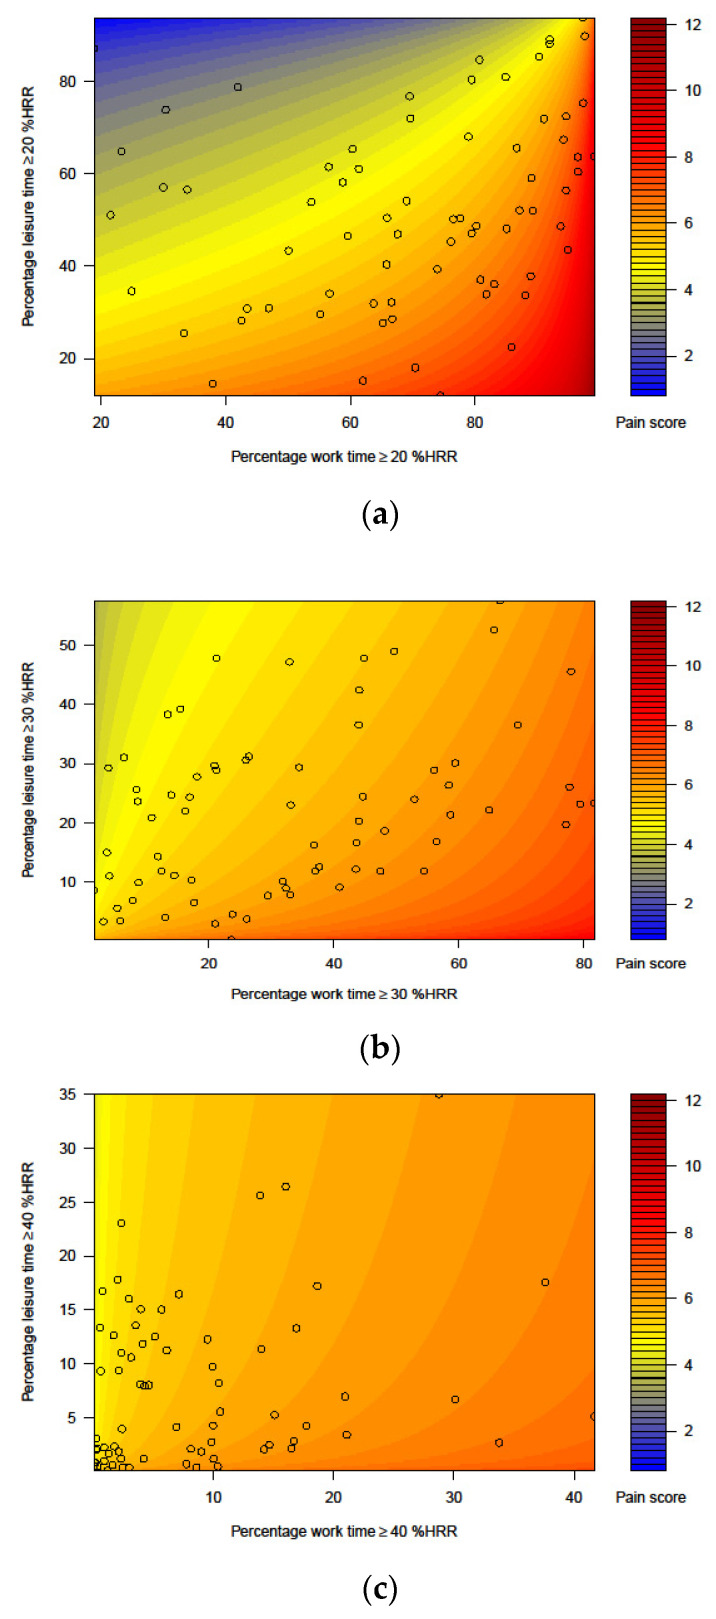
Figure 3.
Heat maps illustrating the predicted average overall musculoskeletal pain score (scale from 0 to 27) over the 2-year follow-up at different baseline percentages of time (a) ≥20 %HRR, (b) ≥30 %HRR, and (c) ≥40 %HRR at work and during leisure. In each panel, the black circles show individual, observed compositions of time at work and in leisure. The figures illustrate the pain score according to the regression model only within the range of compositions represented in the sample (n = 72).

