Figure 4.
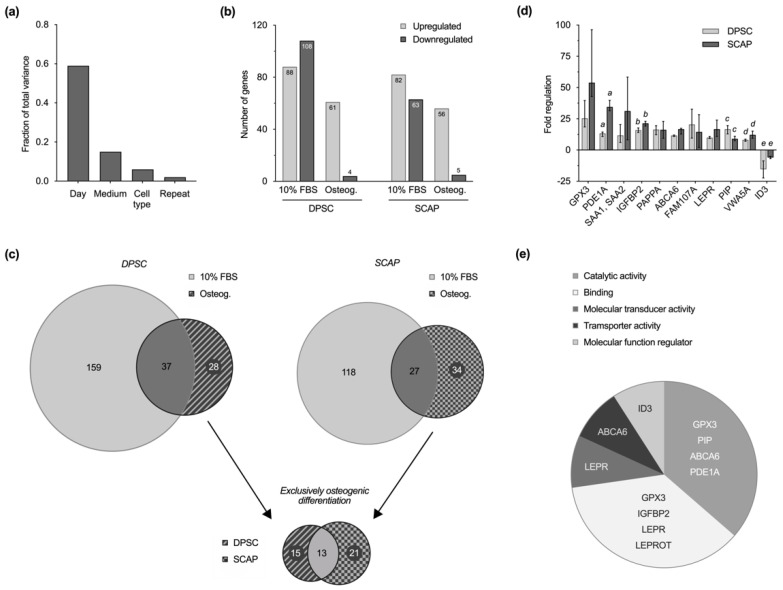
Transcriptome analysis. (a) Fraction of total variance highlights the impact of culture time on gene regulation among other culture parameters. (b) Number of up- and downregulated genes within the investigated groups on day 14 compared to day 1. Similarities between dental pulp stem cells (DPSC) and stem cells from the apical papilla (SCAP) are visible in standard cell culture and osteogenic differentiation. Fewer genes were regulated during differentiation and most of them were upregulated on day 14 of cell culture. (c) VENN diagrams for each cell type reveal subsets of genes that are specifically regulated in standard culture or osteogenic differentiation. Comparison of exclusively regulated genes during osteogenic differentiation of DPSC (28) and SCAP (34) enables the identification of 13 key genes that play a key role in osteogenesis of both cell types. (d) Microarray validation by quantitative reverse transcription PCR (qRT-PCR). Regulation of selected genes in DPSC and SCAP during induced differentiation at day 14 as median values and 25–75% percentiles. Regulations of all genes were statistically significant compared to baseline (p ≤ 0.0236), whereas equal lower-case letters for each gene indicate pairs (DPSC and SCAP) with significant differences (p ≤ 0.05). (e) PANTHER classification of 13 key genes according to molecular function. Genes with unknown or unapproved function are not shown (SAA2/SAA2-SAA4/SAA4, SAA1, GPM6B, FAM107A, PAPPA, VWA5A).

