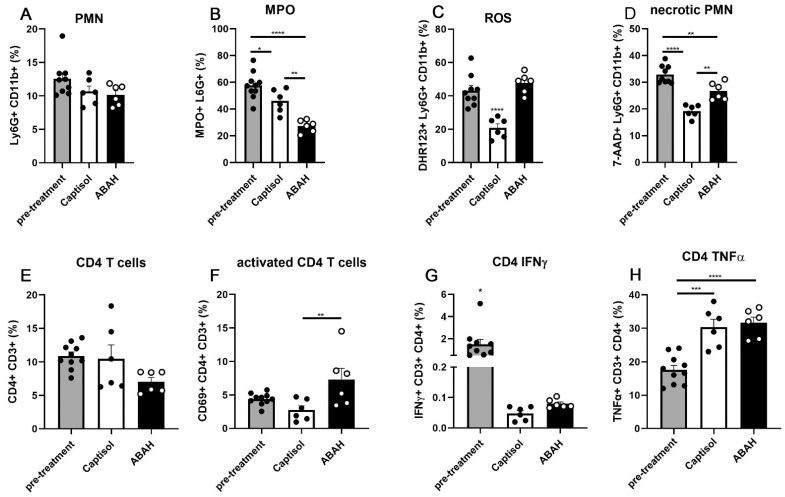
Figure 2.
Characterization of neutrophils and T cells in lungs of M. tuberculosis infected mice. C3HeB/FeJ mice were aerosol-infected with 100–150 CFUs H37Rv, and single-cell suspensions of the lungs were prepared at 25 dpi (pre-treatment) or 35 dpi (Captisol, ABAH), labeled with indicated markers, and analyzed by flow cytometry. Neutrophil numbers did not change between the groups (A). MPO expression of neutrophils was reduced upon ABAH treatment (B). Rates of ROS production by and necrosis of neutrophils were reduced upon mock treatment (C,D). Frequencies of CD4 T cells were similar in all groups (E) while activated ones were more numerous in the ABAH-treated group (F). For intracellular cytokine staining, cells were re-stimulated with CD3/CD28 (G,H). Before treatment start at 25 dpi, frequencies of IFN-g-producing CD4 T cells were higher and those of TNF-a-producing CD4 T cells were lower when compared to the mock- and ABAH-treated groups at 35 dpi. Gating strategy for flow cytometry in Supplementary Figure S5. Depicted is one experiment with 6–10 mice per group. Error bars indicate SEM, ordinary one-way ANOVA with Tukey’s multiple comparisons test. *: p ≤ 0.05, **: p ≤ 0.01, ***: p ≤ 0.005, ****: p ≤ 0.001.

