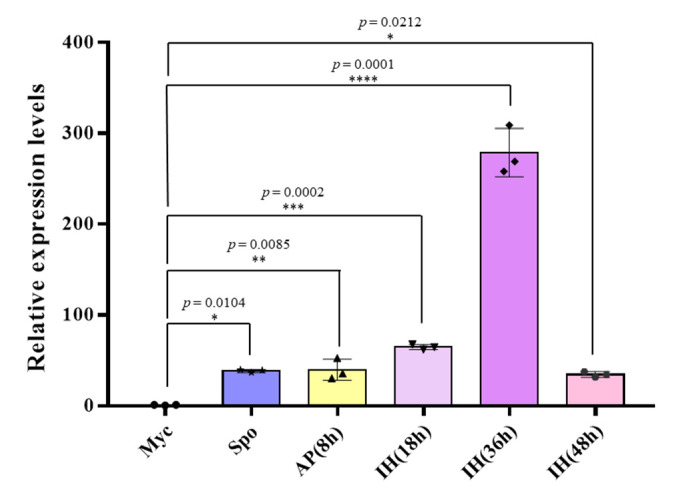
Figure 2.
Expression pattern of MoPtep1 in different stages. Samples from vegetative (mycelium and spore) and invasive stages (8, 18, 36, 48 hpi) of barley epidermis were performed by qRT-PCR. Myc: mycelium; Spo: spore; AP: appressoria; IH: invasive hyphae. The bar represents the standard error of the three technical duplications. Significance analysis was analyzed by Student’s t-test, and * indicates p < 0.05, ** indicates p < 0.01, *** indicates p < 0.001, and **** indicates p < 0.0001.

