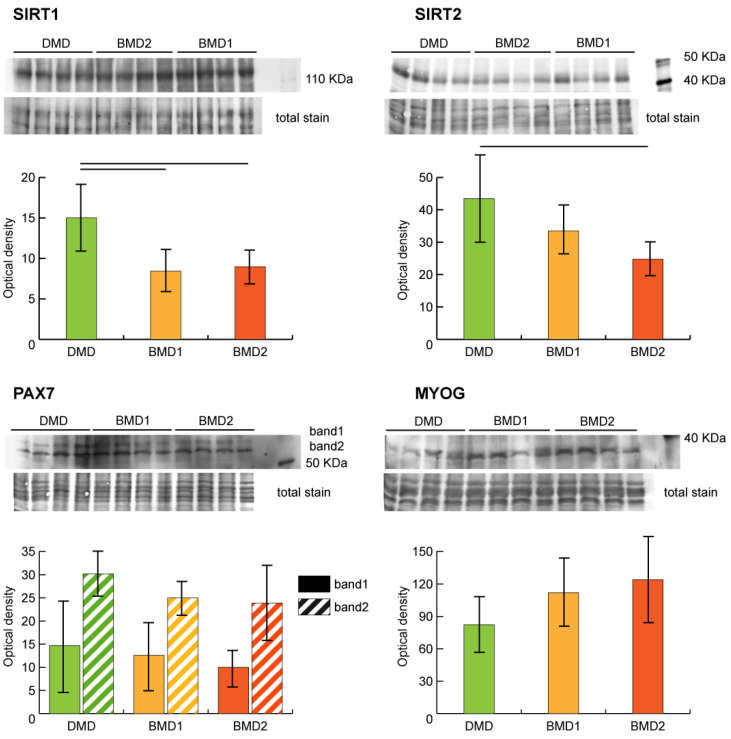
Figure 4.
Representative immunoblot images and bar graphs (mean ± SD) showing protein abundance of NAD-dependent protein deacetylases sirtuin-1 (SIRT1) and sirtuin-2 (SIRT2), paired box protein Pax7 (PAX7), and myogenin (MYOG). Data were normalized against the total amount of loaded proteins stained with Sypro Ruby. Statistical analysis was performed by one-way ANOVA and Tukey’s test (horizontal black lines above the bars = significant changes, n = 4, p < 0.05). Full-length images are available in Supplementary Figure S1.

