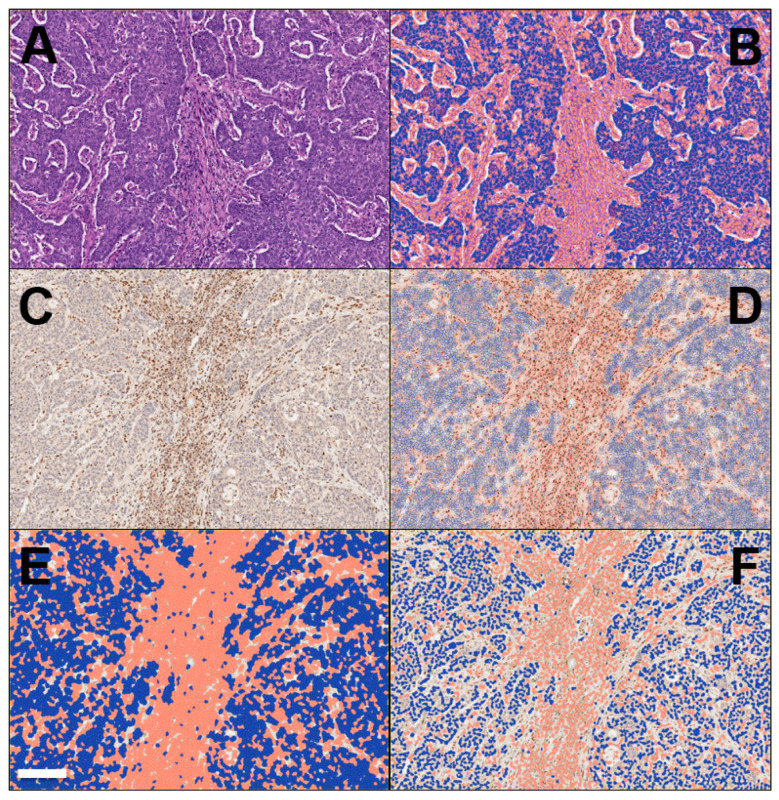
Figure 3.
Representative workflow of the digitalization of a case of colon cancer with microsatellite instability is provided here (provided by Claudio Luchini, co-author). (A) Cancer area: tumor cells and peri-tumor cells, including stromal cells and immune cells, are here shown. This is the point of the start of the analysis on a slide stained with hematoxylin-eosin (original magnification: 10×). (B) The digitalized system is able to separate cancer cells (here colored in blue) from non-cancer cells (red). (C) The immunohistochemistry for mismatch-repair proteins can be also taken into account in this process. This figure represents MSL-staining, showing the loss of the protein into the neoplastic component, while its expression in retained in non-tumor cells (original magnification: 10×, same field of hematoxylin-eosin). (D) The digitalized system is able to interpret the results of immunohistochemistry, based on a deep learning approach. In this step, the system shows its ability to separate cancer cells (here colored in blue) from non-cancer cells (brown). (E,F) Since the immunohistochemistry for mismatch-repair proteins is a nuclear staining, for finalizing its interpretation the system here shows its ability in the detection and analysis of only cell nuclei, with tumor cells in blue and non-tumor cells in red (E,F; different resolution of analysis, which can be adapted based on staining patterns and the difficulty of their interpretation). Scale bar represents 200 μm.

