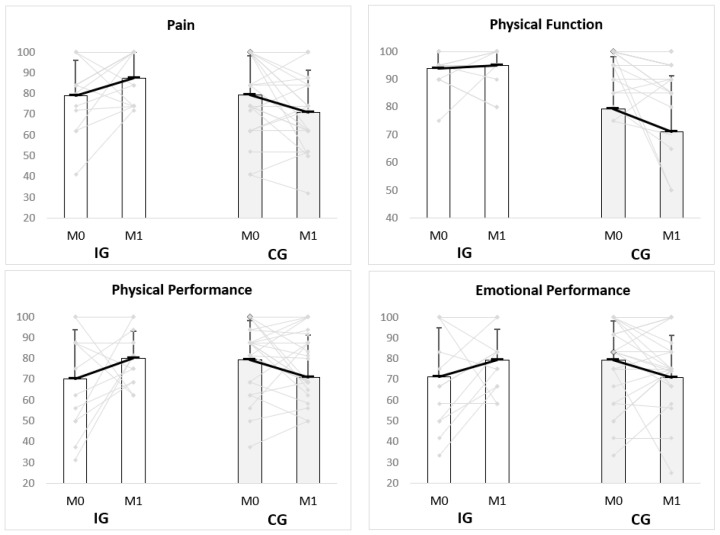
Figure 2.
Means (SD) and scores of each individual for the domains Pain, Physical Function, Physical Performance and Emotional Performance of SF-36 (score from 0 to 100, with 100 representing the best health status and 0 indicating the worst health status) in M0 and M1, by group (the black lines represent the group mean and the grey lines the values for each individual). M0—baseline, M1—final of intervention, IG—Intervention Group, CG—Control Group.

