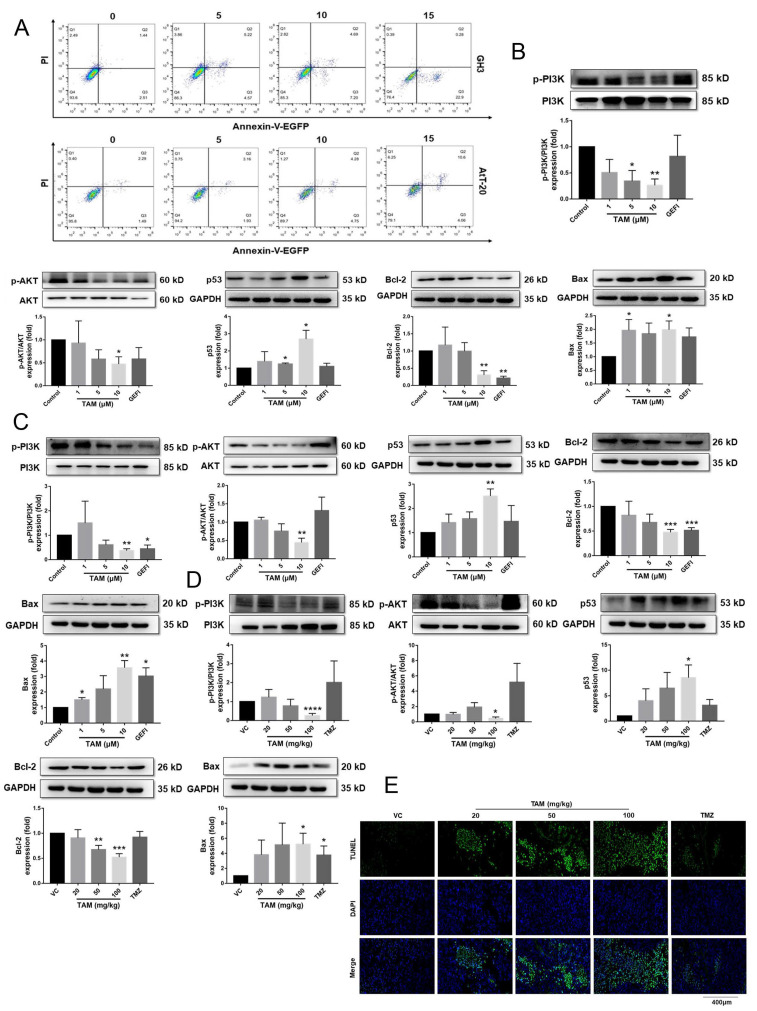
Figure 6.
TAM induced apoptosis of PAs and changed the expression levels of apoptosis-related proteins in PAs. (A) Flow cytometric analysis of apoptosis with cells double stained with Annexin V-EGFP/PI, showing that TAM increased the apoptosis rates of GH3 and AtT-20 cells. (B,C) The expression levels of p53, Bcl-2 and Bax, the phosphorylation levels of PI3K and AKT normalized to GAPDH in GH3 and AtT-20 cells were detected using Western blot. (D) The key protein expression levels of the PI3K/AKT signaling normalized to the GAPDH in tumor tissues were detected using Western blot. (E) Representative tumor tissue sections with TUNEL staining of apoptotic cells (green). Cell nuclei were stained with DAPI (blue). Images are at 40× magnification. VC vehicle control, refers to tumor-bearing mice treated with the vehicle. Bars indicates SEM, * p < 0.05, ** p < 0.01, *** p < 0.001, **** p < 0.0001 vs. control or VC. TAM: tamoxifen; PAs: pituitary adenomas; GEFI: gefitinib; TMZ: temozolomide.

