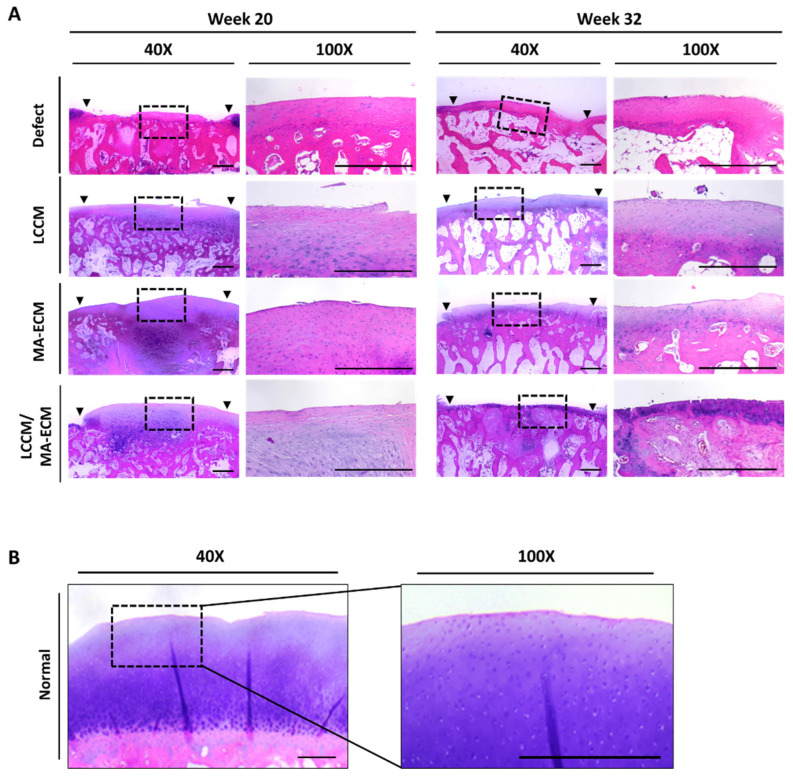
Figure 5.
Hematoxylin and eosin (H&E) staining analysis of knee articular cartilages. (A) Representative H&E stained images of cartilage on weeks 20 (right knee) and 32 (left knee) in each group. Note that denser cell distributions in MA-ECM and LCCM/MA-ECM groups compared to the other groups. (B) H&E stained images of normal cartilage. Black arrows: margins of the osteochondral defect area; black dotted rectangle: low power view (40×) of the area within the rectangle in the right panel (100×). Scale bars = 500 μm.

