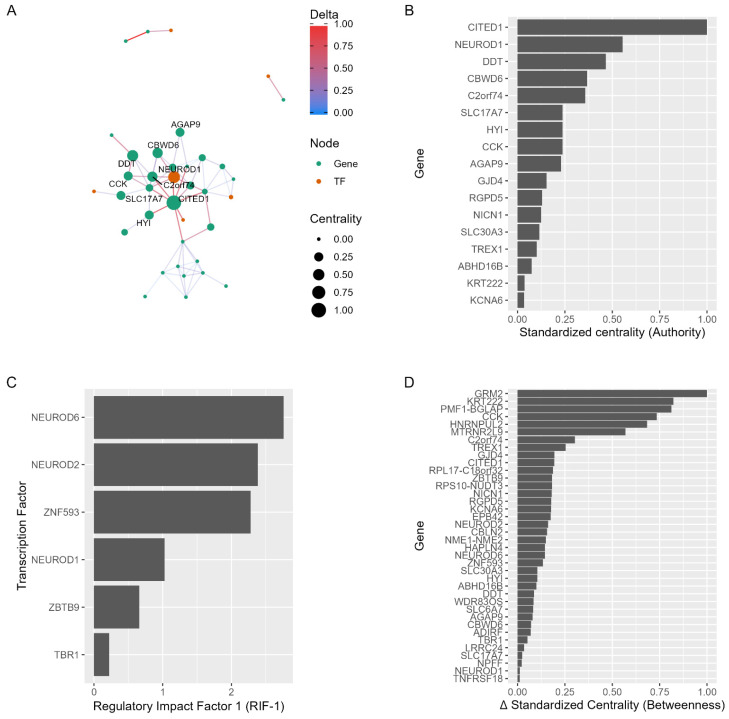
Figure 3.
Differential network and measures of network regulators. (A) Differential network for PDC1 and PDC2 DEGs networks. (B) Bar plot for standardized centrality of genes from the differential network. (C) RIF 1 scores of genes from the differential network. (D) Difference in standardized centrality between genes from PDC1 and PDC2 networks (shown in Figure 2B,C).

