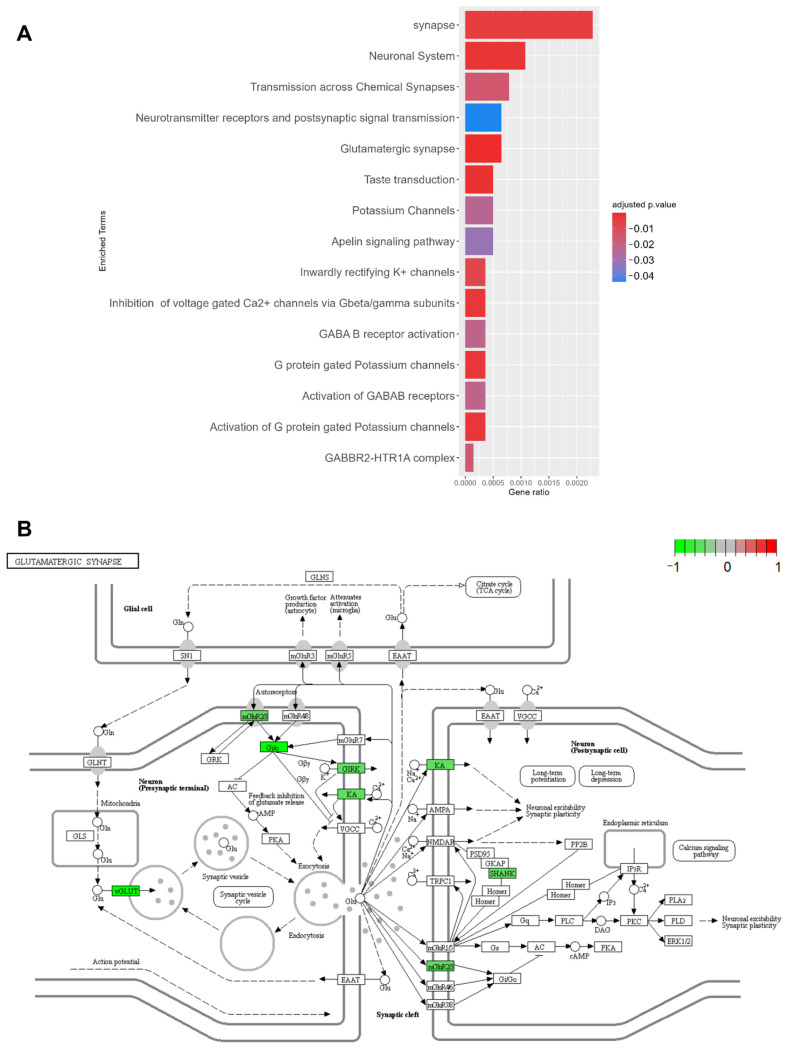
Figure 5.
Investigation of the disease mechanism of PDC1, based on PDC1 vs. NC unique DEGs. (A) Enrichment analysis of DEGs shows that these genes map mostly on synaptic functions, in particular on the glutamatergic synapse. (B) Pheatmap illustration of the glutamatergic synapse pathway, showing downregulation in neurotransmitter uptake (vGLUT) and feedback regulation of neurotransmission (mGluR2) functions.

