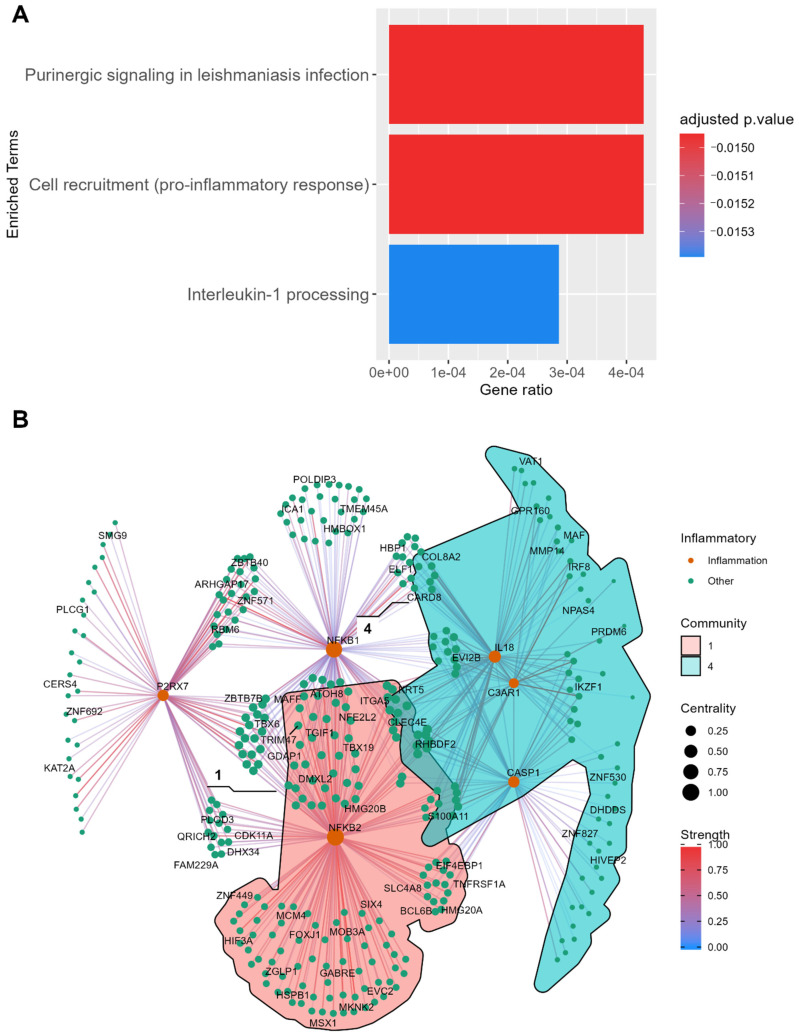
Figure 6.
Investigation of the disease mechanism of PDC2, based on PDC2 vs. NC unique DEGs. (A) Enrichment analysis of DEGs shows that these genes map on inflammatory processes. (B) Gene network showing segregation in communities (only communities with significant PPI scores are colored). The network was built with the Kamada–Kawai layout, where each node is a gene and each edge is a PCIT value between genes.

