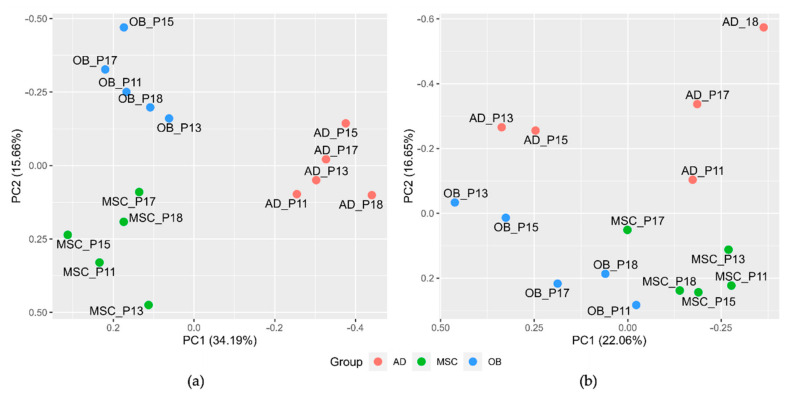
Figure 1.
Unsupervised principal component analysis plots derived from mass spectrometry data ((a), 4108 proteins) and two-dimensional gel electrophoresis data ((b), 1517 protein spots). The three cell lineages MSCs (green), OB (blue), AD (pink) were run in quintuples. P11, p13, p15, p17, and p18 indicate the patient number of the corresponding sample. X- and y-axes show the first and second principal components, respectively.

