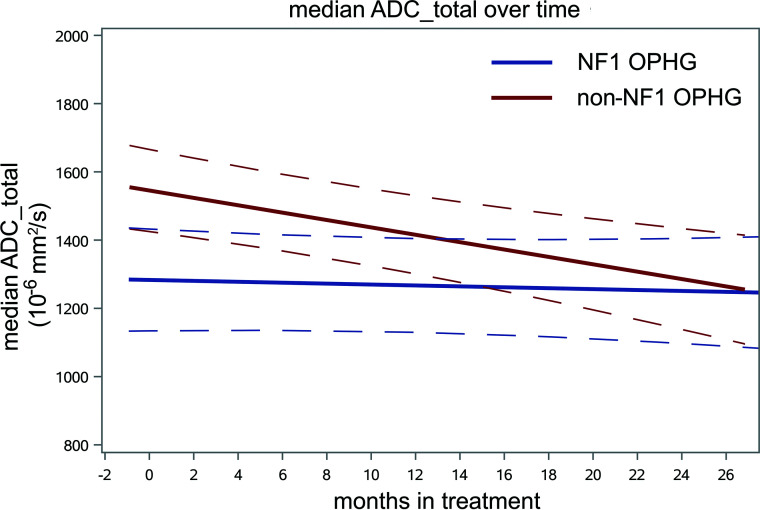
FIG 2.
The longitudinal trend of median ADC of the total tumor volumes for the cohort of 25 sporadic non-NF1 OPHGs from stratum 4 shown in red, compared with the 15 NF1-associated OPHGs shown in blue. Mixed-effects models were used to estimate trends with time in ADC parameters as well as differences in longitudinal changes between groups. Sporadic OPHG values are higher at baseline (P = .002, q = 0.003) and show a greater decrease with time (P = .02, q = 0.06) compared with NF1-associated OPHG.

