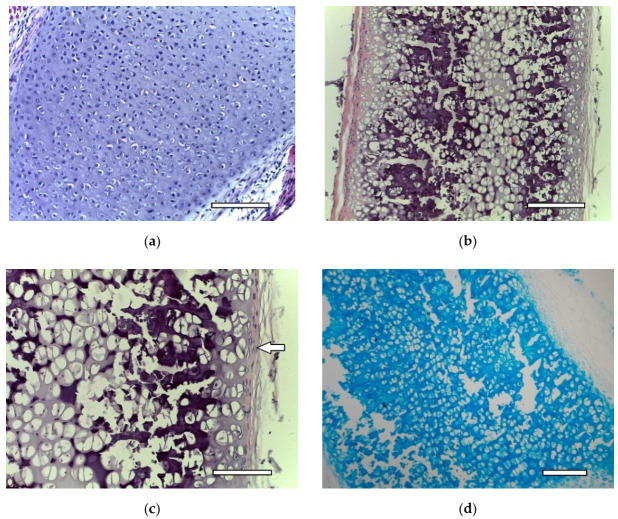
Figure 2.
Costal rat cartilage. (a) native cartilage, staining with hematoxylin and eosin, objective lens ×20, scale bar—100 μm; (b) decellularized sample, staining with hematoxylin and eosin, objective lens ×10, scale bar—200 μm; (c) decellularized sample, staining with hematoxylin and eosin, objective lens ×20, scale bar—100 μm. Perichondrium cells are shown by arrows; (d) decellularized sample, staining with alcian blue, objective lens ×10, scale bar—200 μm.

