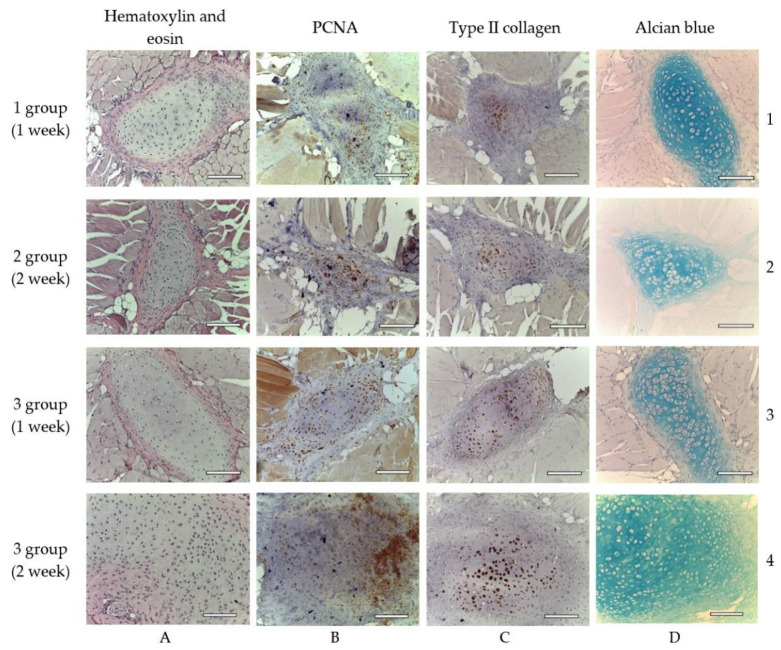
Figure 8.
Cartilage tissue in animals of different experimental groups, objective lens ×20, scale bar—100 μm. Explanation in the text. (A1–D1)—1st group (dECM only), 1 week; (A2–D2)—2nd group (MSC only), 2 weeks; (A3–D3)—3rd group (dECM and MSC), 1 week; (A4–D4)—3rd group (dECM and MSC), 2 weeks. (A)—staining with hematoxylin and eosin; (B)—staining for PCNA; (C)—immunohistochemical staining for type II collagen; (D)—staining with alcian blue.

