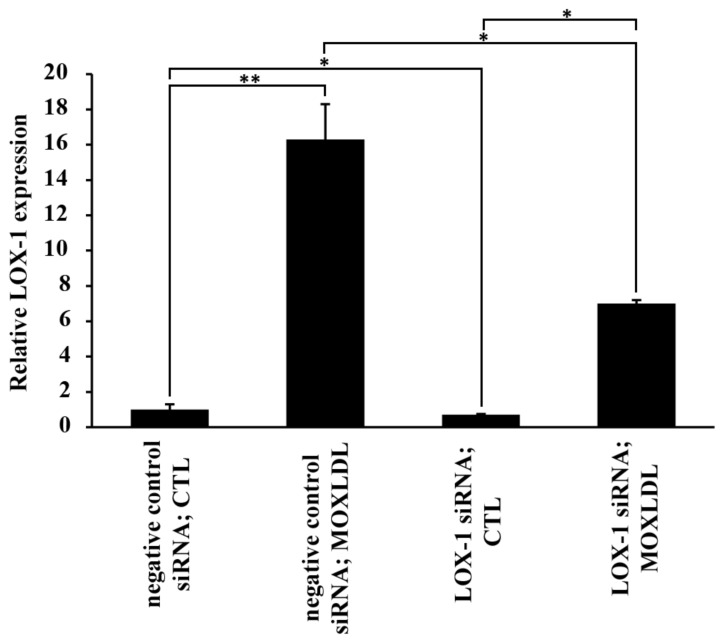
Figure 3.
The effect of Mox-LDL on LOX-1 expression in HAECs. Bar graph representing LOX-1 mRNA expression in HAECs transfected with negative control or LOX-1 siRNA and then treated with mock medium (CTL) or Mox-LDL (MoxLDL), as detected by qPCR and normalized to GAPDH from three independent experiments. Data are presented as the mean ± SEM (n = 3) fold change in mRNA expression. Statistically significant differences were determined by one-way ANOVA followed by Tukey’s multiple comparison post hoc test (* p < 0.05; ** p < 0.01).

