Figure 7.
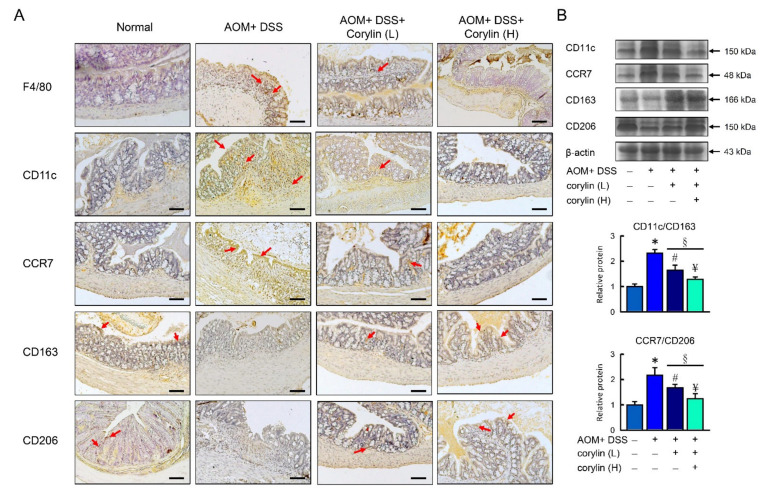
Corylin alters macrophage polarization in AOM/DSS-induced colitis mice. (A) Representative F4/80, CD11c, CCR7, CD163, and CD206 staining of colon. Red arrows highlight the positive staining. Scale bar: 100 μm. (B) Above: Western blot analysis of CD11c, CCR7, CD163, CD206, and β-actin (loading control) in colon. Below: Quantification of CD11c, CCR7, CD163, and CD206 protein levels in graphs indicating quantification ratio of CD11c and CD163 as well as ratio of CCR7 and CD206 levels. Results represent mean ± SEM. * p < 0.05, Normal compared with DSS; # p < 0.05, AOM/DSS compared with AOM/DSS + Corylin (L); ¥ p < 0.05, DSS compared with AOM/DSS + Corylin (H); § p < 0.05, DSS + Corylin (L) compared with DSS + Corylin (H). AOM, azoxymethane; DSS, dextran sodium sulfate.

