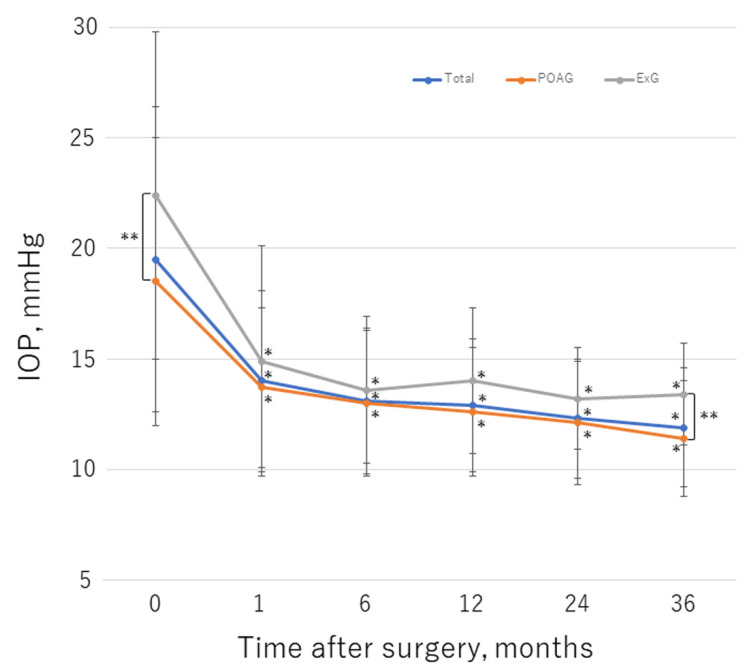
Figure 3.
Changes in mean IOP over the course of follow-up. *, statistically significant difference between the preoperative value and each time point. **, statistically significant difference between the POAG and ExG group. Error bar shows the standard deviation. ExG, exfoliation glaucoma; IOP, intraocular pressure; POAG, primary open-angle glaucoma.

