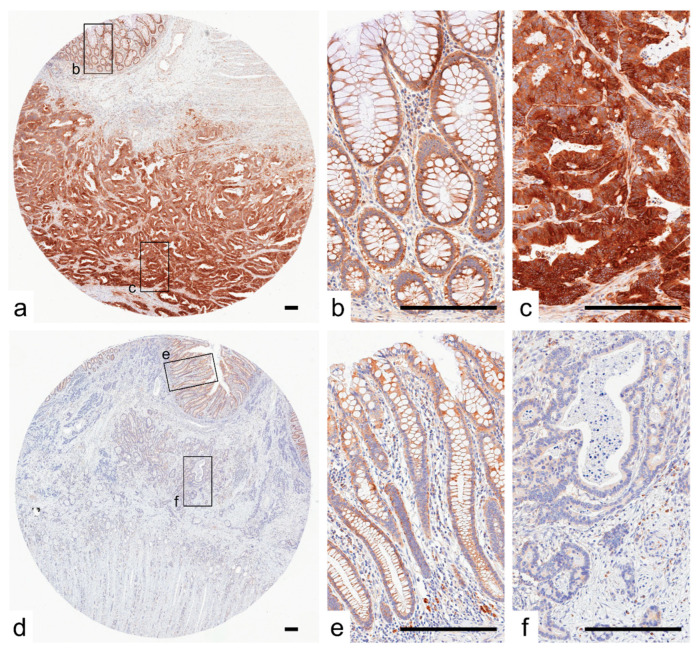
Figure 1.
Representative images of SPATA18 immunostaining. (a–c), Representative images of SPATA18-high CRC. SPATA18 was weakly and strongly expressed in the cytoplasm of non-neoplastic colonic epithelial cells (b) and CRC cells (c), respectively. (d–f), Representative images of SPATA18-low tumors. CRC cells exhibited lower levels of cytoplasmic SPATA18 expression (f) than non-neoplastic colonic epithelial cells (e). SPATA18-positive immune cells were present in both non-neoplastic and neoplastic stroma. Bar, 200 μm.

