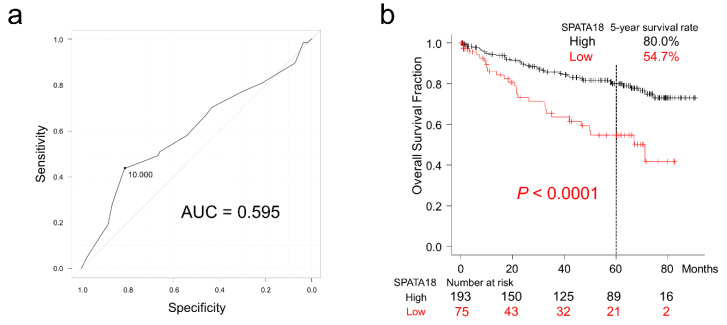
Figure 2.
Overall survival of patients with colorectal cancer classified according to SPATA18 expression. (a), ROC curve for SPATA18 expression at the patient’s death. The cut-off value was defined from the closest point to the upper-left side. (b), Kaplan-Meier curves for patients classified by SPATA18 expression.

