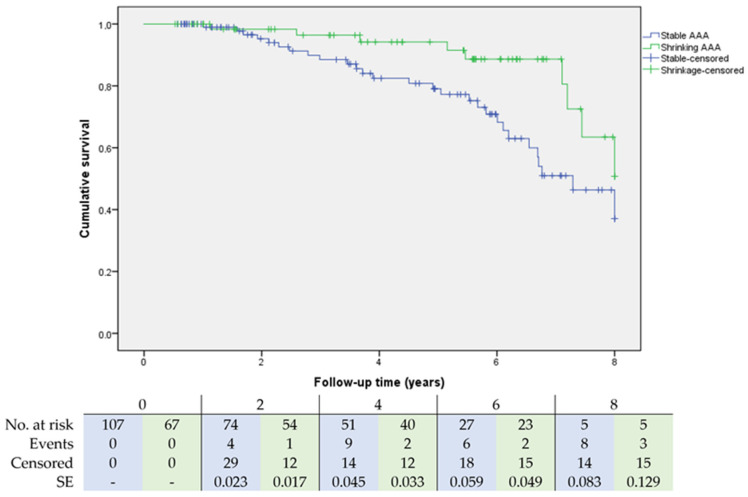
Figure 2.
Kaplan-Meier survival analysis of freedom from death for stable and shrinking AAA through eight years. Number at risk represents patients at risk at that timepoint; events and censored were evaluated at end of interval. A blue color represents the stable AAA group, and a green color represents the shrinking AAA group. SE = standard error.

