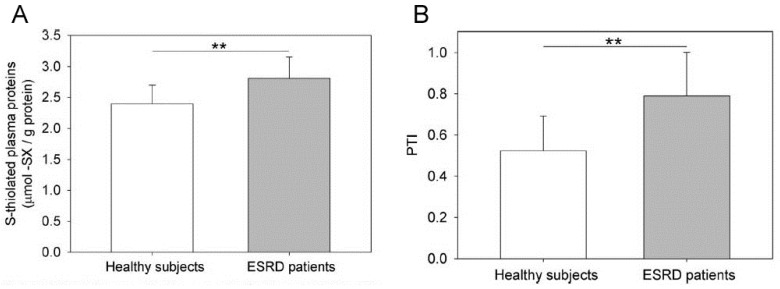
Figure 3.
S-thiolated plasma proteins and PTI in ESRD patients compared to healthy subjects. (A) The plasma proteins of ESRD patients (n = 20) and age-matched healthy subjects (n = 20) were analysed for their total S-thiolated protein content by colorimetric reaction with ninhydrin. The data are expressed as the mean ± SD. The differences between the means of the two groups were evaluated using Student’s t-test (** = p < 0.001). (B) The plasma of both ESRD patients (n = 20) and age-matched healthy subjects (n = 20) was analysed for PTI. The data are expressed as the mean ± SD. The differences between means of the two groups were evaluated using Student’s t-test (** = p < 0.001). Reprinted with permission from Colombo et al. [101].

