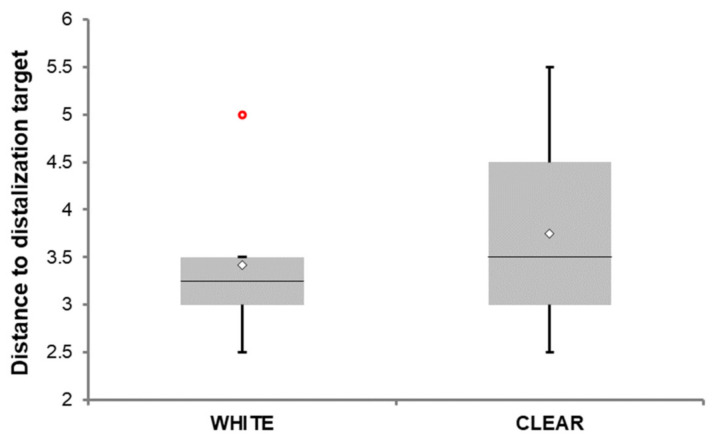
Figure 17.
Data distribution of distance to distalization target stratified by type of photopolymer. Data are presented as the median (horizontal line) and mean (diamond sign), the lower-upper quartile range, minimal and maximal values. The red circle denotes an observation with a large but legitimate value that fell outside of the presumed normal distribution. A two-sample t-test verified by its non-parametric alternative was used to test the between-group differences in the distance. The difference between group means was not statistically significant (p = 0.578). Finally, tertiary objective was to examine patients’ preference after they had completed treatment with either white or clear (transparent) material. Only two patients out of a total of 12 patients (16.7%) preferred white resin over the transparent one. The question was “Which of these two materials would you consider more aesthetically appeasing for a distalizer if you can choose?”. They were shown examples of both materials together.

