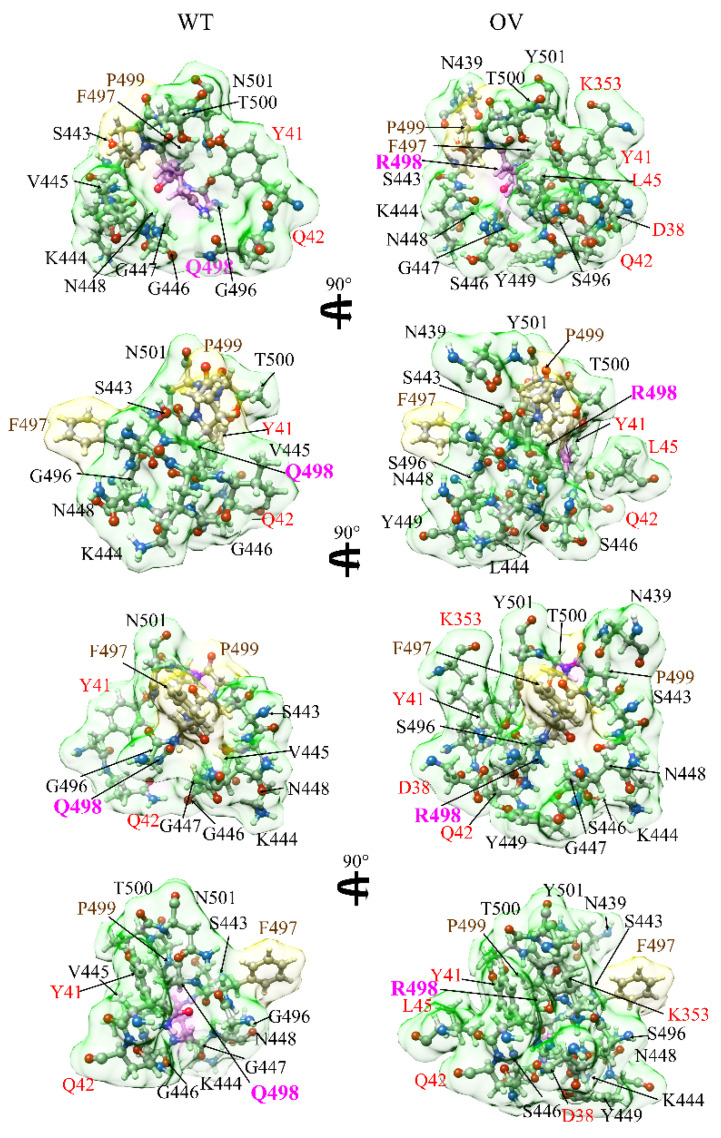
Figure 3.
Interaction change due to mutation at site 498 for both WT (left) and OV (right). The surface of site 498 is marked in magenta color. The surfaces of its NN AAs and NL AAs are shown in yellow and green, respectively. Visible NN and NL AAs are marked near their surface in brown and black, respectively. NL AAs from ACE2 are marked in red. We can see considerable changes in NL AAs and their shapes due to mutation.

