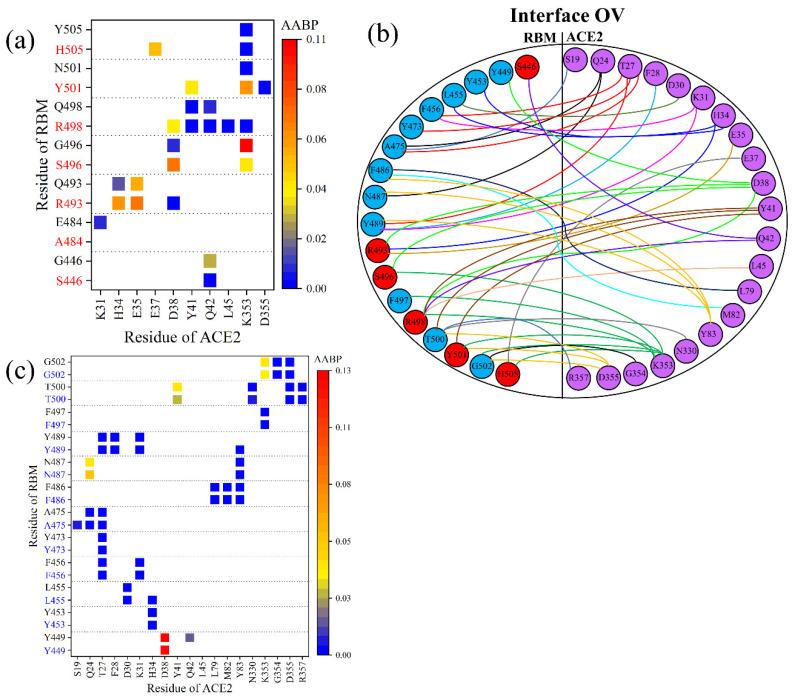
Figure 4.
Comparison of RBM–ACE2 interaction in the interface model for WT and OV. (a) AABP map focusing on changes in bonding at the interface of mutated sites for WT (black) and OV (red). (b) Interactions at the RBM-ACE2 interface for OV. Interface-interacting AAs in RBM are shown in blue and red circles, denoting mutated and unmutated AAs, respectively. Similarly, interacting AAs of ACE2 are shown in purple. Different colored lines are used just for clarity. (c) AABP map focusing on changes in bonding of interface of unmutated sites for WT (black) and OV (blue).

