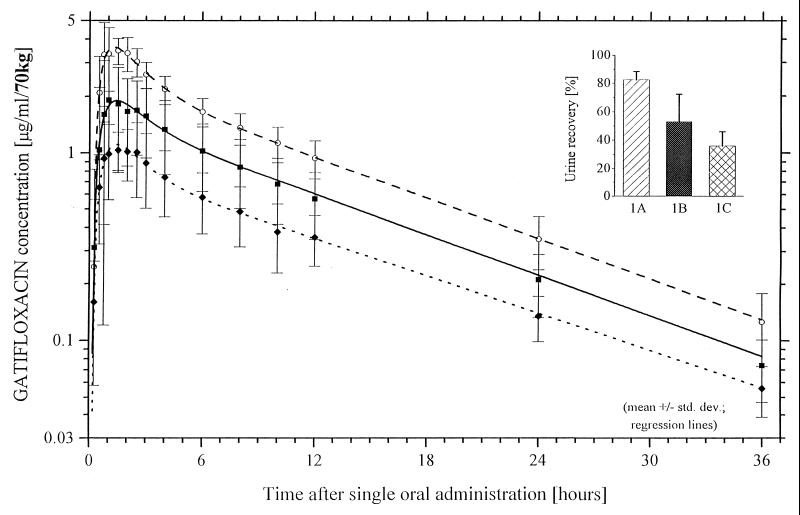
FIG. 2.
Gatifloxacin (400 mg) plasma concentration-time curves and urinary recovery levels for treatments A to C (group 1) determined by HPLC. ○, group 1, treatment A, gatifloxacin alone; ■, group 1, treatment B, gatifloxacin and two aluminum magnesium hydroxide single-use flasks 2 h before gatifloxacin; ⧫, group 1, treatment C, gatifloxacin concomitantly with two aluminum magnesium hydroxide single-use flasks.

