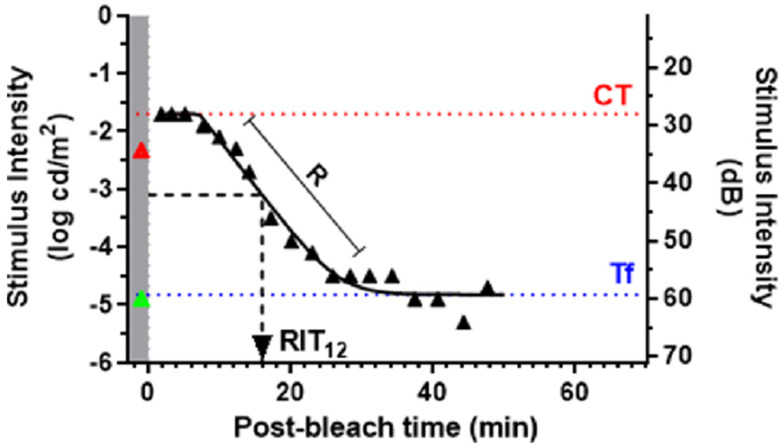
Figure 2.
The Dark Adaptation curve reproduced with permission from Uddin et al. [38] This shows a representative dark adaptation curve along with key derived parameters. The gray region with the green and red triangles illustrates the measurement of scotopic thresholds at 505 nm and 625 nm respectively before delivery of bleach. Following exposure to a bleaching light, retinal sensitivity reaches an initial plateau mediated by cones (CT). Once rods become more sensitive to cones (Cone-rod break), retinal sensitivity continues to improve at a fixed rate (R dec/min) before reaching final asymptotic rod threshold (Tf). Rod intercept time (RIT), the time taken to detect a stimulus of −3.1 log phot cd/m2 has been widely used to assess DA in AMD.

