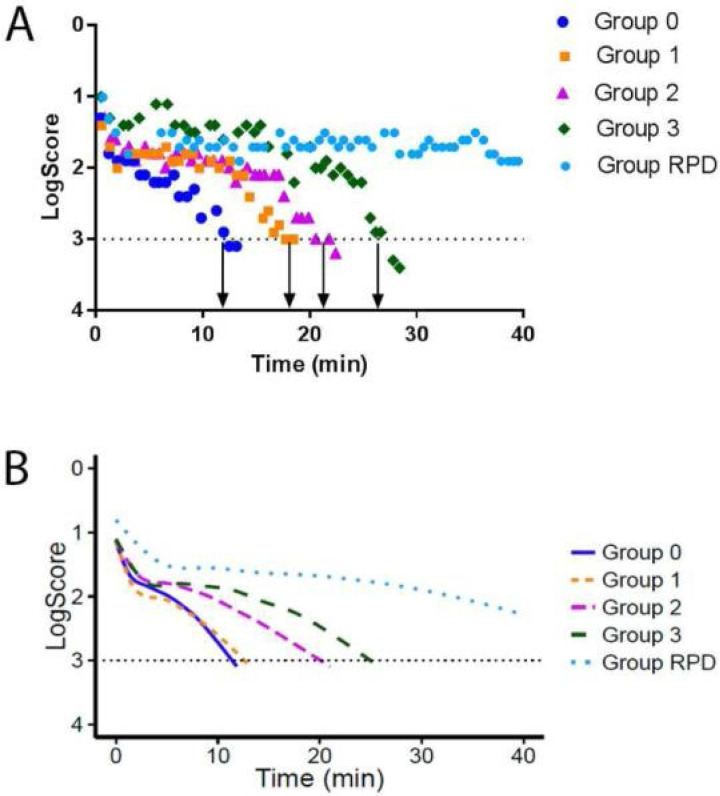
Figure 3.
Impaired DA in different AMD stages. Reproduced with permission from Flamendorf et al. [98], an example for impaired DA in different AMD stages. (A). Representative dark adaptation raw data for individual participants with no large drusen (group 0), large drusen in the study eye only (group 1), large drusen in both eyes (group 2), advanced disease in the nonstudy eye (group 3), and reticular pseudodrusen (RPD). The rod intercept time is the time required for the patient’s visual sensitivity to recover to a stimulus intensity 3 log units dimmer than the initial threshold (arrows). (B). Graph showing averaged raw data for each group. The group curves were derived by averaging the fitted values over a grid of points (2-s intervals) from time 0 to 40 min based on a 3-component piecewise linear fit to the raw data (excluding fixation errors).

