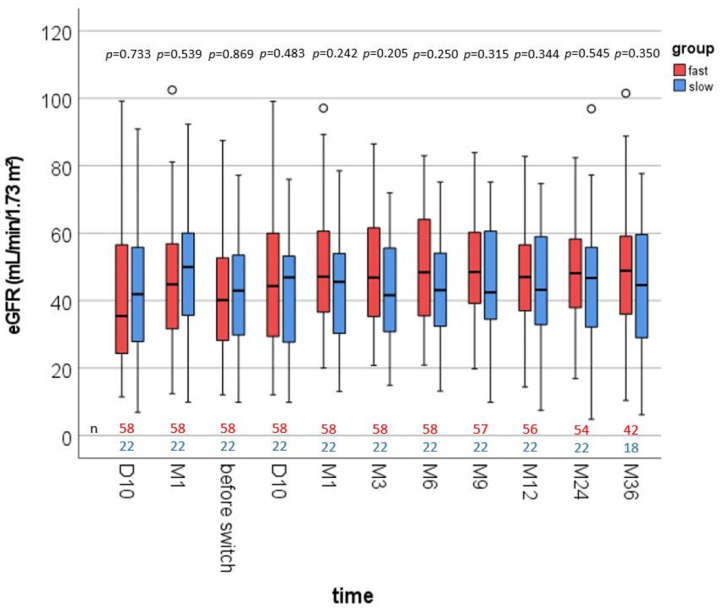
Figure 2.
Boxplots of the renal function at different time points (eGFR, estimated glomerular filtration rate) within 3 years after kidney transplantation. p-values are from Mann–Whitney U tests comparing fast vs. slow metabolizers at each time point. There were no noticeable differences between the groups after conversion.

