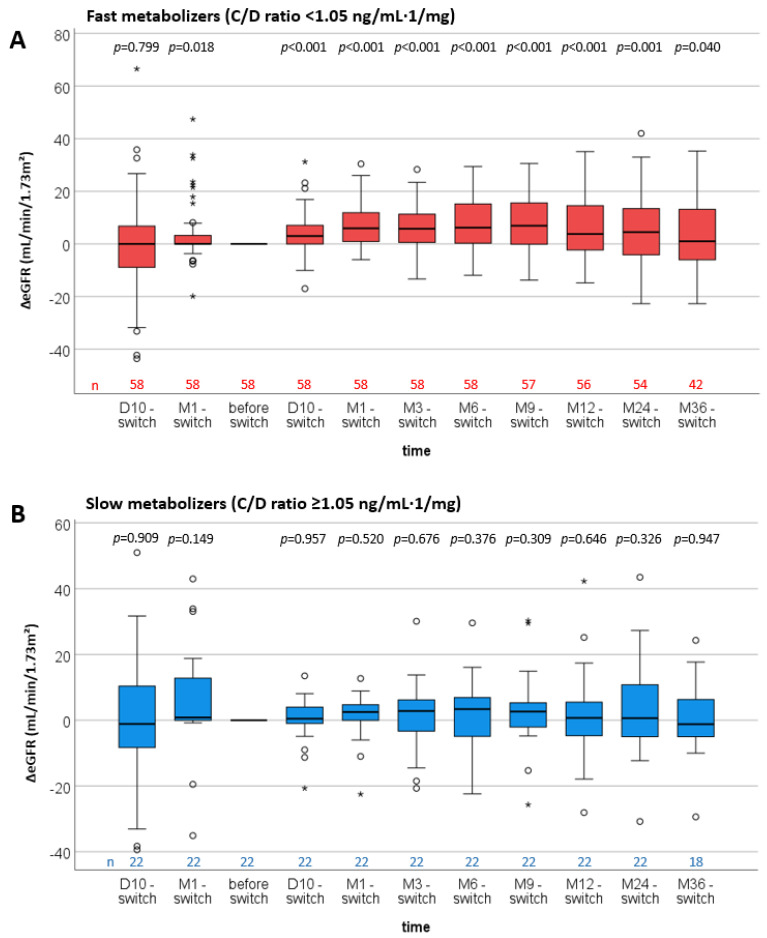
Figure 3.
Boxplots of the differences in estimated glomerular filtration rates (ΔeGFR) of fast and slow Tac metabolizers (all time points—date of the switch). p-values are from Wilcoxon-signed rank tests for the dependent comparisons of eGFR values at each time point with the eGRF values at the time of the switch. The C/D ratio cut-off to characterize the metabolizer group was 1.05 ng/mL·1/mg. Fast metabolizers developed a noticeable increase in ΔeGFR at D10 after conversion and all following time points (A). ΔeGFR values of slow metabolizers remained stable during the 3 years after the switch (B).

