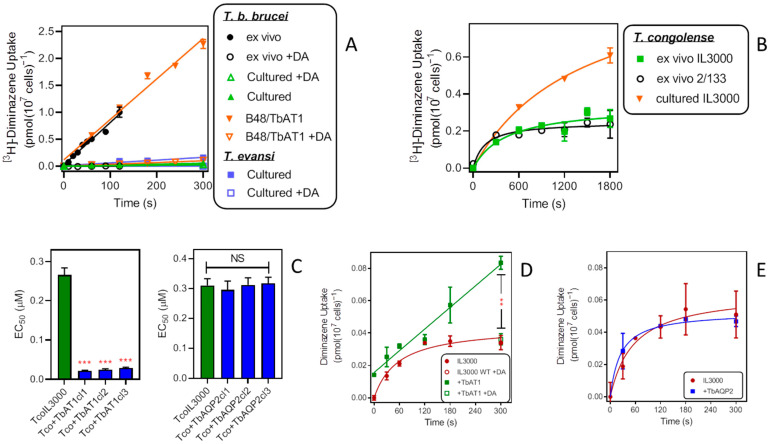
Figure 4.
Effects of TbAT1 and TbAQP2 on diminazene aceturate (DA) uptake and sensitivity by T. congolense. (A) Uptake of 0.1 µM [3H]-diminazene (DA) in cultured and ex vivo T. brucei and cultured T. evansi bloodstream forms. All lines were calculated by linear regression with r2 > 0.95. +DA indicates the addition of 1 mM DA to the assay buffer. In the absence of excess DA all slopes were significantly different from zero (p < 0.01) and not significantly non-linear (p > 0.3). All symbols are average ± SEM of triplicate determinations. (B) Uptake of 0.1 µM [3H]-DA in cultured and ex vivo T. congolense. Lines were calculated by non-linear regression. All symbols are averages ± SEM of triplicate determinations. (C) Sensitivity of T. congolense IL3000 (green bars) and TcoIL3000 expressing either TbAT1 or TbAQP2 to DA. Bars show averages ± SEM of three independent EC50 determinations. *** p < 0.001 by t-test; NS, not significant. (D) Uptake of 0.2 µM [3H]-DA in cultured IL3000 or the same cells expressing TbAT1, lines being calculated by non-linear and linear regression (r2 = 0.98), respectively. All symbols are averages ± SEM of triplicate determinations. ** p < 0.01. (E) Like D but with IL3000 expressing TbAQP2.

