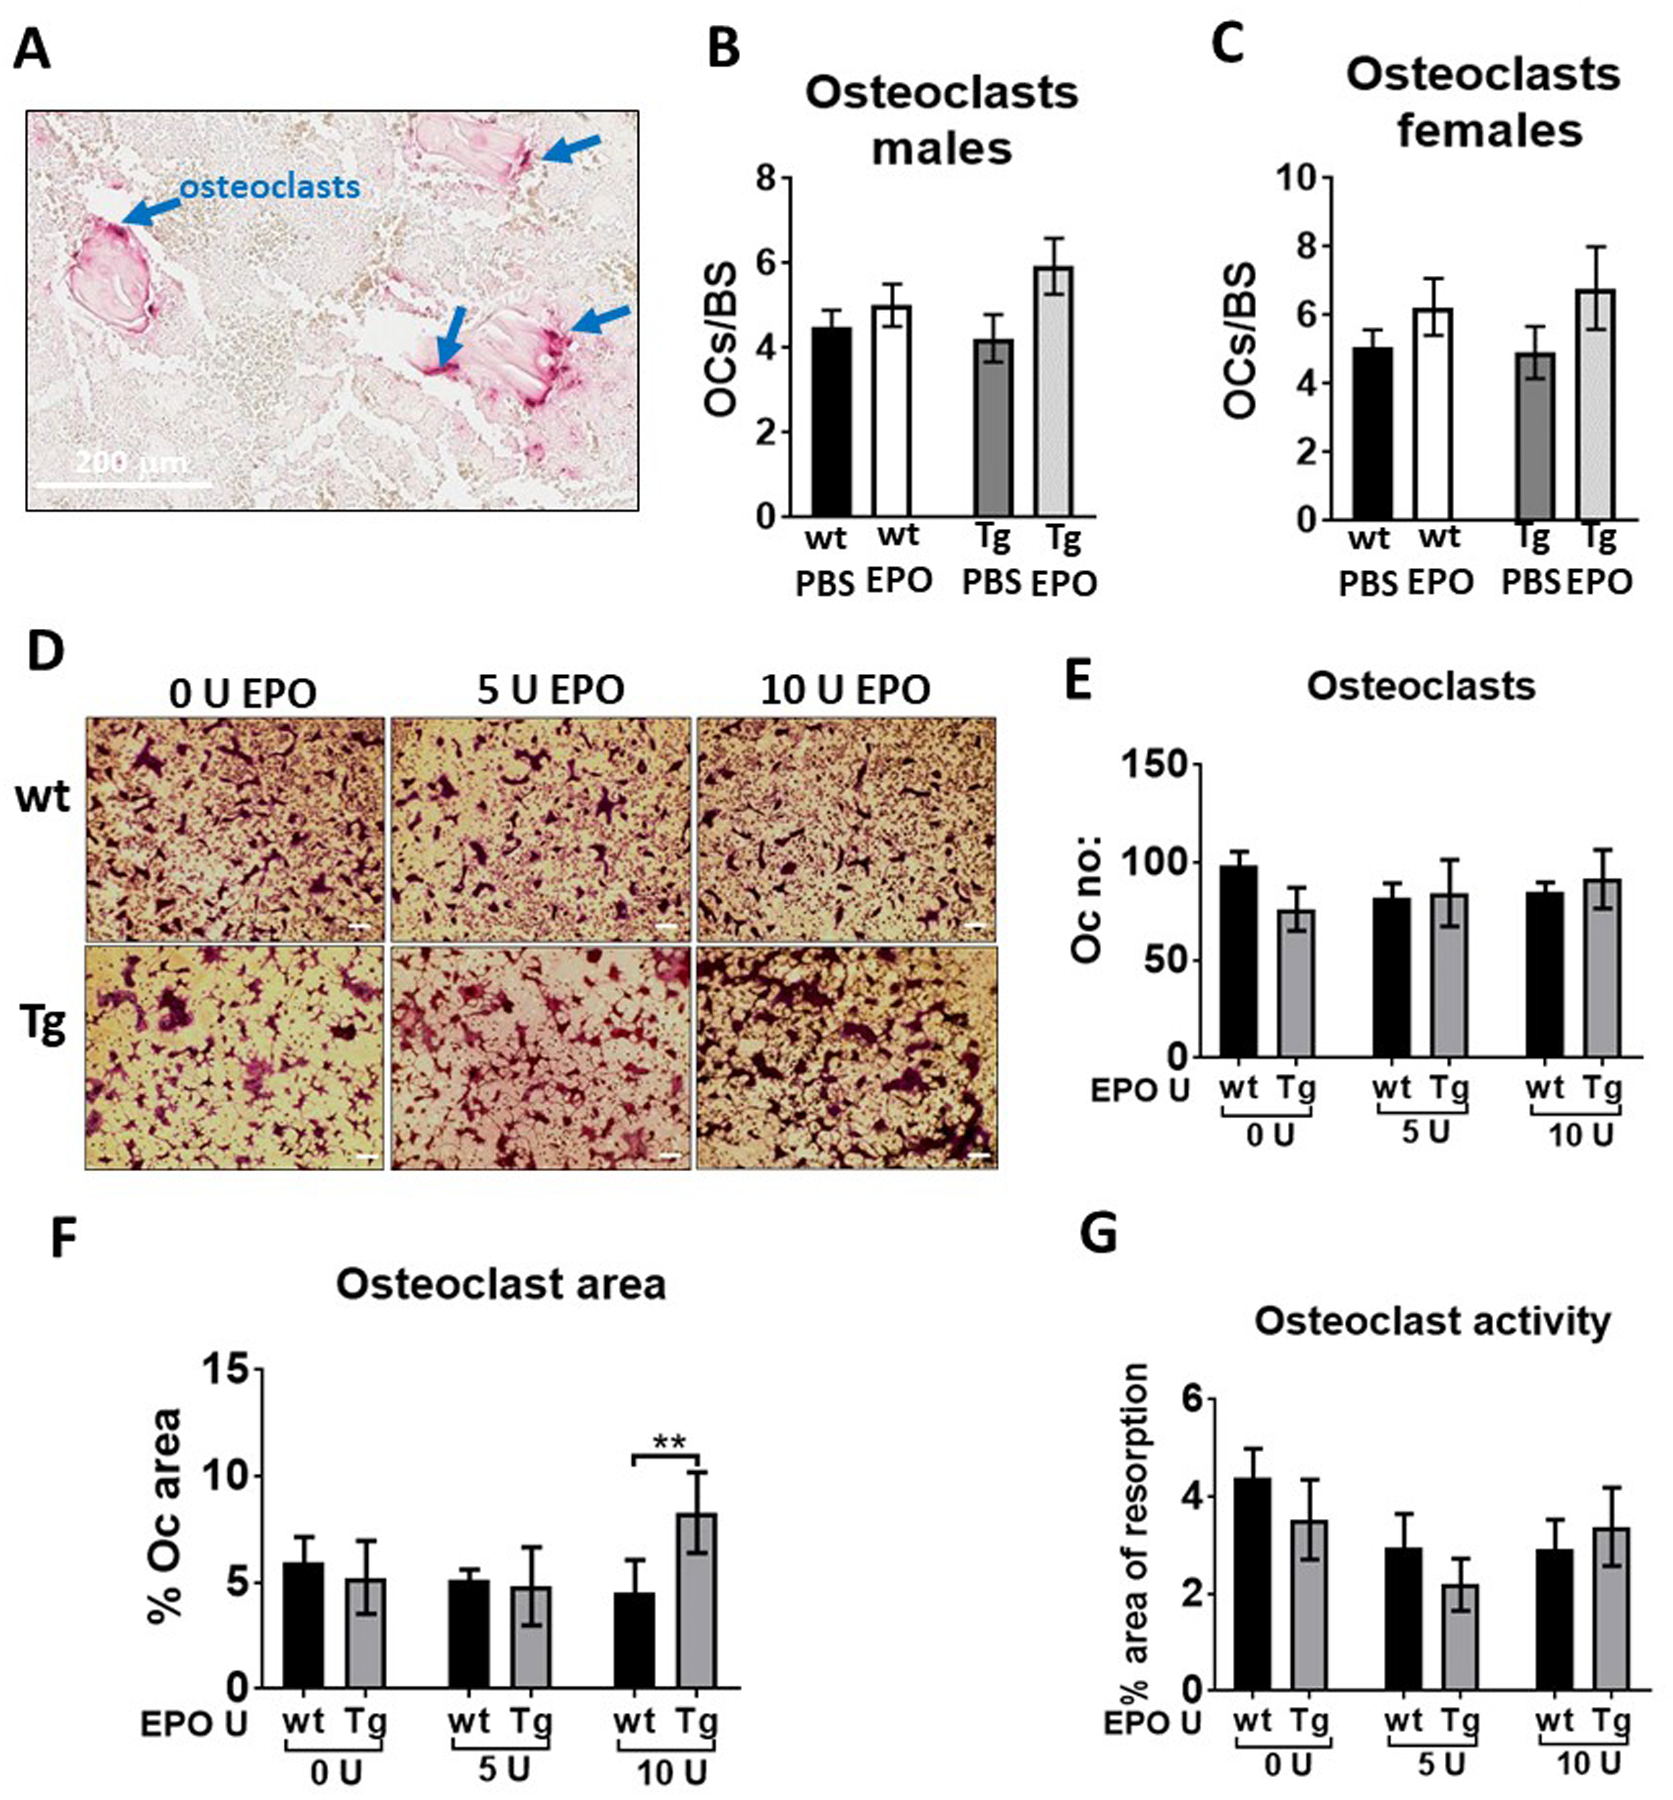
Figure 7:

Enumeration of osteoclasts in vivo and in vitro in Tg mice and littermate controls. (A) Image of TRAP positive osteoclasts on the surface of trabecular bone. (B-C) quantification of TRAP positive osteoclasts per bone surface in male (B) and female (C) wt and Tg mice with either saline or EPO treatment. (D) Images of in vitro osteoclast differentiation of bone marrow cells of wild type (wt) and Tg mice using M-CSF and RANKL. Osteoclasts appear after 4–5 days and were stained for TRAP, scale bar 50 μm. (E) Enumeration of number of TRAP stained osteoclasts in culture using ImageJ analysis software. (F) Quantitation of osteoclast area in cultures using ImageJ analysis software. (G) Quantitation of osteoclast activity by counting area of resorption using Corning Osteo assay surface plates (n=5/group).
