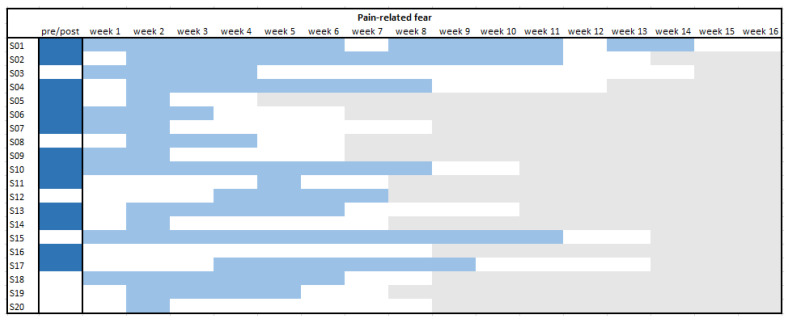
Figure 4.
Overview of individual significant reductions per phase for pain-related fear.  pre–post effect (p < 0.05);
  change in trend (p < 0.05);
  non-significant change;
  end of EXP. Note. A light blue box means the trend of scores before that specific week was significantly different than the trend of scores after this point. A white box after a light blue box means that that week no big changes occurred anymore.

