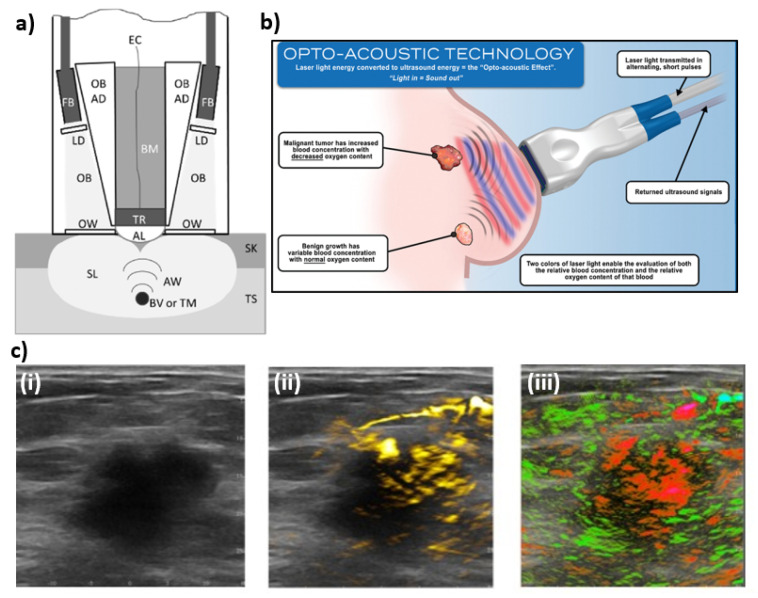
Figure 10.
(a) Schematic diagram of the Imagio system. Tissue (TS), skin (SK), scattered light (SL), optical beams (OB), fiber bundles (FB), light diffusers (LD), optical windows (OW), acoustic waves (AW), blood vessels or tumors (BV or TM), acoustic lens (AL), transducers (TR), electrical cables (EC), backing material (BM). (b) Illustration shows that laser light emitted at wavelengths corresponding to absorption peaks of oxygenated and deoxygenated hemoglobin produces acoustic signals that can then be used to reconstructed oxygen saturation maps. (c) An example of combined ultrasound/photoacoustic images of breast carcinoma—(i) An ultrasound gray scale image of a 2.6 cm malignant mass, (ii) regions of increased total hemoglobin, and (iii) oxygenation map where red are regions below an average oxygen saturation of 85% while green are normally oxygenated regions (>90% sO2).

