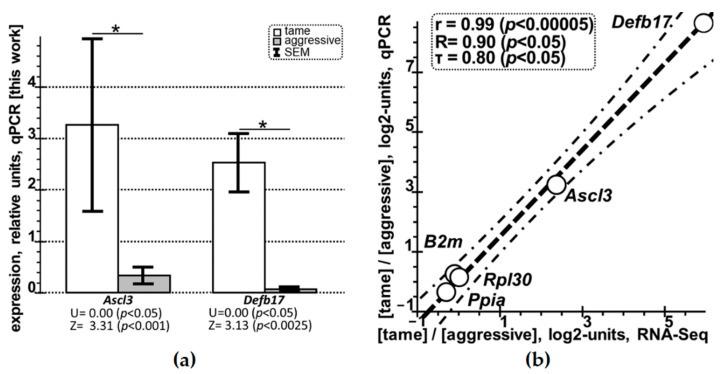
Figure 1.
qPCR-based selective verification of the DEGs identified by RNA-Seq in this work in the hippocampus of tame versus aggressive rats. Legend: (a) in tame male adult rats (white bars) versus aggressive ones (grey bars), both DEGs examined (i.e., Ascl3 and Defb17) are statistically significantly overexpressed in the hippocampus (here, bar height (i.e., mean), error bars (i.e., standard error of the mean [SEM]), and asterisks denote statistical significance at p < 0.05 according to both the nonparametric Mann–Whitney U-test and parametric Fisher’s Z-test). Asterisk (symbol “*”), statistically significant at p < 0.05. (b) Statistically significant correlations between the relative expression levels of the two selected DEGs and three reference genes (i.e., B2m (β-2-microglobulin), Ppia (peptidylprolyl isomerase A), and Rpl30 (ribosomal protein L30)) in the hippocampus of tame versus aggressive rats (open circles), as measured experimentally by RNA-Seq (X-axis) and qPCR (Y-axis) and presented on the log2 scale (see “Materials and Methods”). Dashed and dash-and-dot lines denote linear regression and boundaries of its 95% confidence interval calculated using Statistica software (StatsoftTM, Tulsa, OK, USA). r, R, τ, and p are coefficients of Pearson’s linear correlation, Spearman’s rank correlation, Kendall’s rank correlation, and their p values (statistical significance), respectively.

