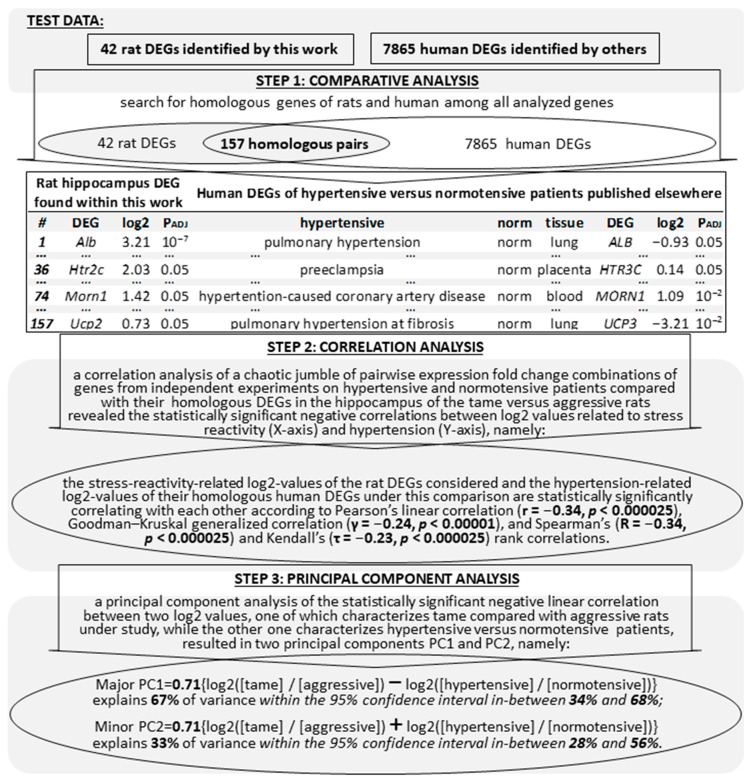
Figure 2.
A step-by-step diagram of verification of the obtained results on the hypertensive versus normotensive animals examined in this work with respect to all the transcriptomes (that we could find) of hypertensive versus normotensive patients (Table 5). Legend: see the footnote of Table 2; PC1 and PC2: principal components calculated using the PAST4.04 software [77].

