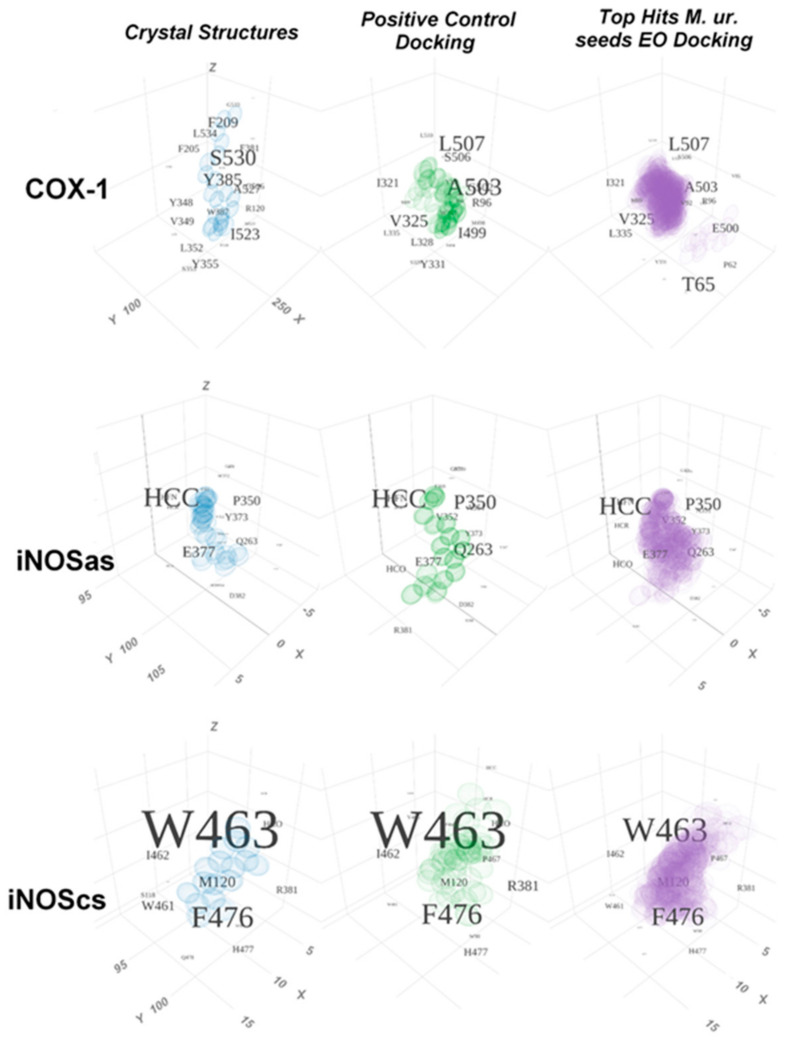
Figure 8.
Tridimensional graphic representation of the major contacts at the active site for positive controls and top compounds from essential oils from M. urundeuva seeds. The tridimensional representation (at the x, y, z axes) of each respective active site is arbitrarily centralized at the geometrical center of the set of atoms involved in contacts around all the analysis. The grid spacement at the three-dimensional space in each graphic is always of 5 Å at each dimnension. The density of the spheres on the image depicts how many superposed atoms there are at that region between different docks with the same ligand (the three first poses from the docking procedure were considered) and between different compounds. The font size depicting the residue identity and number increases according to the average intensity of the contacts involving it (i.e., the average contact area superposition between the ligands and the residue). The subdivision of the large Heme group was carried out as mentioned in the Materials and Methods section. From top to bottom it can be noticed the contacts for the COX-1, iNOSa.s. and iNOSc.s. pockets. From the left to the right the respective contact intensities for the crystallographic controls (the arachidonic acid contacts at the PDB-ID:1DIY for COX-1, the L-Arginine-iNOS contacts at the PDB-ID:3NOS plus the isothiourea-iNOS contacts at the PDB-ID:4NOS for iNOSa.s., the tetrahydroneopterin-iNOS contacts at the PDB-ID:4NOS for iNOSc.s.); for the docked three first poses for the most positive controls (arachidonic acid for COX-1, bis-isothiourea for iNOSa.s. and tetrahydropterin for iNOSc.s.); as well the three first poses of the top hits for each site are depicted. M. ur. = Myracrondruon urundeuva. EO = Essential oil.

