Figure 2.

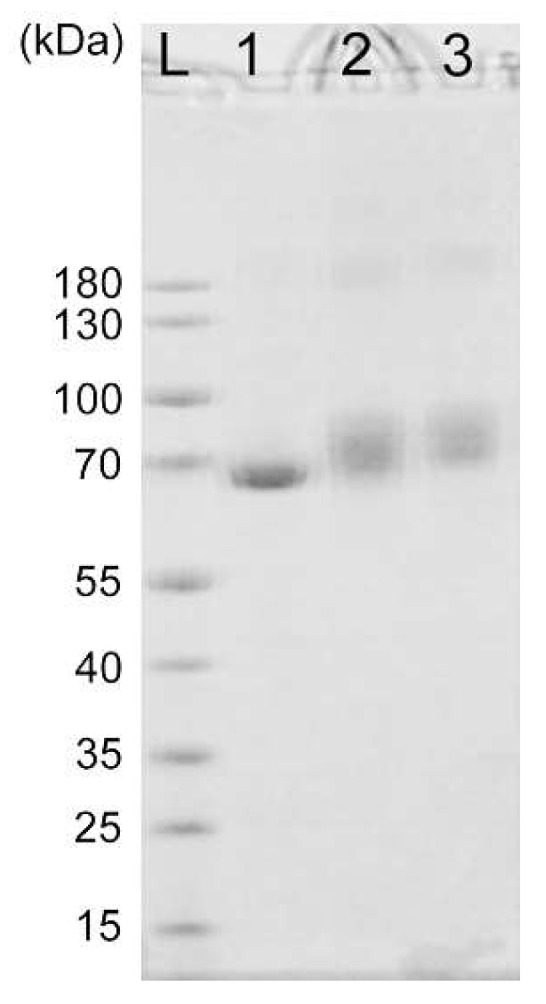
SDS-polyacrylamide gel electrophoresis of BSA. Lane L is the protein ladder. Lanes 1–3 represent images of BSA, SMCC-treated BSA, and BSA-Apt, respectively.

SDS-polyacrylamide gel electrophoresis of BSA. Lane L is the protein ladder. Lanes 1–3 represent images of BSA, SMCC-treated BSA, and BSA-Apt, respectively.