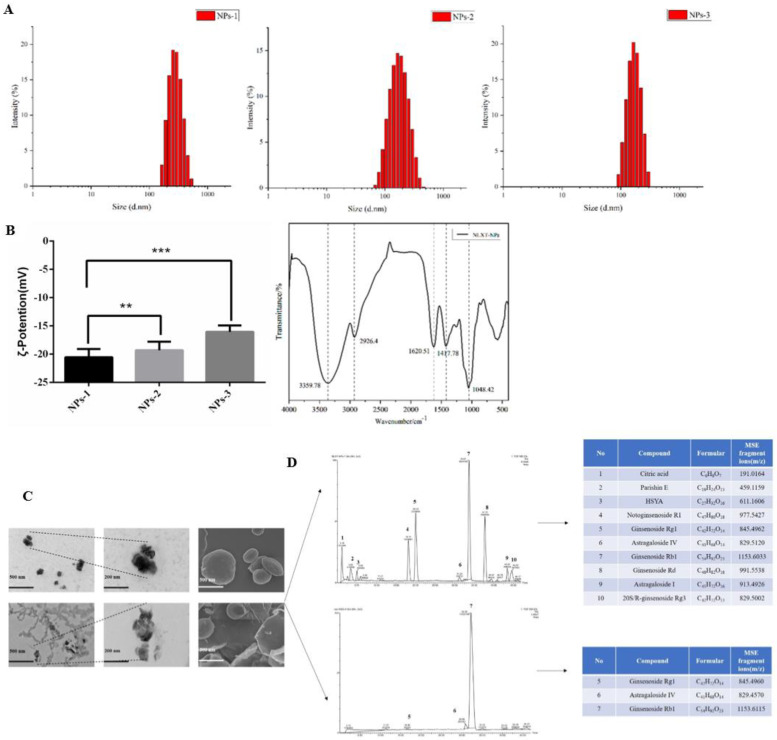
Figure 1.
(A) The particle size distribution diagram of nanoparticles with different concentrations (NPs−1 3.80 mg·mL−1, NPs−2 1.90 mg·mL−1 and NPs–3 0.95 mg·mL−1); (B) Representation of the potential of nanoparticle solutions with different concentrations, values are the mean± SD (n = 6), and the infrared spectra of NLXT-NPs; Compared with NPs-1, ** p < 0.05, *** p < 0.01; (C) The TEM and SEM picture of NLXT-NPs dialysis in 10 h (up) and 12 h (down); (D) The chemical composition of NLXT-NPs dialysis in 10 h (up) and 12 h (down).

