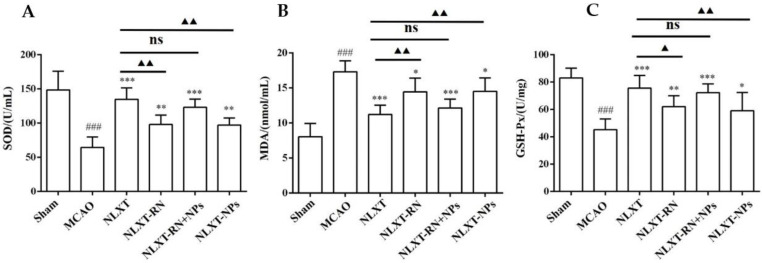
Figure 4.
Effect of administration groups on the level of SOD (A), GSH-Px (B), and MDA (C) of MCAO rat models (n = 8). ### p < 0.001, compared with sham group; * p < 0.05, ** p < 0.01, *** p < 0.001, compared with MCAO group; ns: no significant difference, ▲ p < 0.05, ▲▲ p < 0.01, compared with NLXT group.

