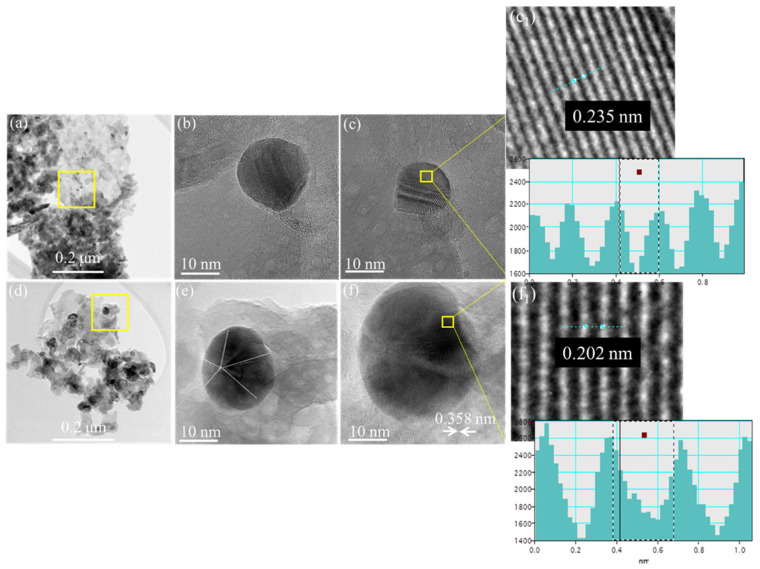
Figure 4.
STEM micrographs: (a) low magnification of sample Ag_TiO_LYO/500; (b) HRTEM images of an individual Ag NP; (c) HRTEM image of two stacked Ag NPs; (c1) illustrates the d-spacing confirmed by line-profile from the region highlighted with yellow square; (d) low magnification of sample Ag_TiO_LYO/650; (e) HRTEM image of Ag nanocluster with five-fold symmetry; (f) HRTEM image of an individual Ag nanocluster incorporated into a TiO2 layer with anatase structure with d(101) = 0.358 nm; (f1) illustrates the d-spacing confirmed by line-profile from the region highlighted with yellow square.

