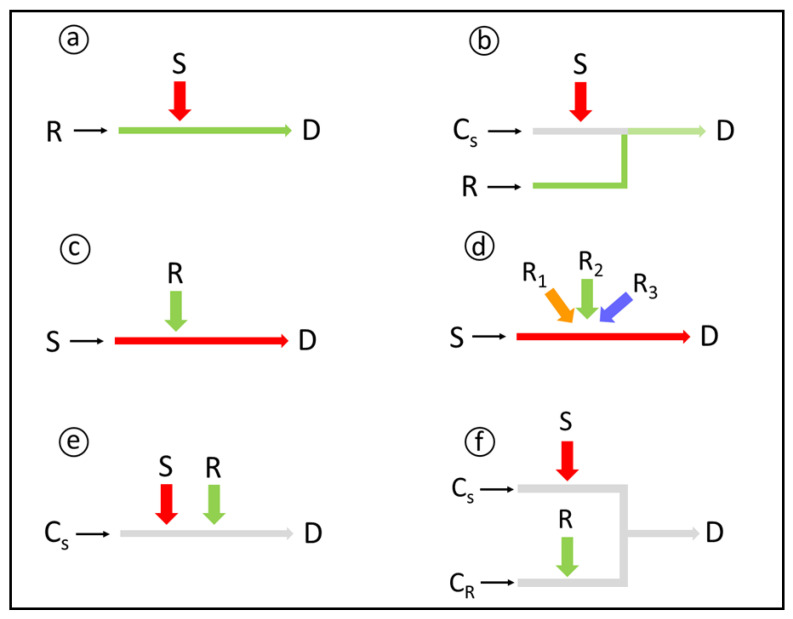
Figure 1.
Configurations for sample and reagent insertions in flow analysis. S: sample; R, R1, R2, R3: reagents; CS: sample carrier stream; CR: reagent carrier stream; D: detection; Large arrows: time-based, loop-based, hydrodynamical or syringe insertions; Small arrows: flow directions; Flow diagrams: a—single line, b—confluent, c,d—reverse flow injection, e—single line merging zones, f—confluent merging zones. Further sample processing may occur before detection. For details, see text.

