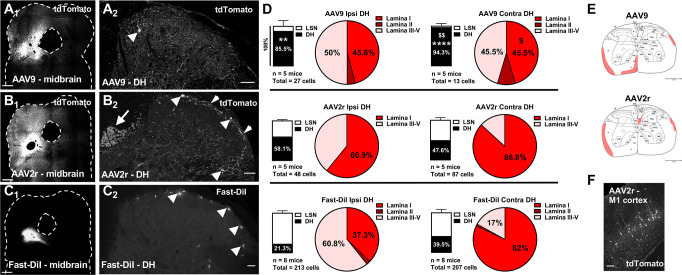
Fig 1. Targeting of spinoparabrachial neurons by AAV9, AAV2retro, and DiI.
A-C, Representative images of the parabrachial complex (A1, B1, C1; scale bars = 500 μm) and dorsal spinal cord (A2, B2, C2; scale bars = 50 μm) following parabrachial complex injections of AAV9 (A), AAV2retro (AAV2r, B), or Fast-DiI (C). The images in B2 and C2 represent a maximum intensity projection of 3D stacks spanning 12 and 16 μm, respectively, and collected with a 4-μm z-step. Arrowheads in A2, B2 and C2 highlight labeled spinal projection neurons in the superficial dorsal horn. Additionally, in B2, the short arrow highlights a plexus of labeled processes in lamina I, and the long arrow indicates labeling of the dorsal corticospinal tract. D, Stacked Bars represent the relative distribution of labeled projection neurons between the dorsal horn (DH) and the lateral spinal nucleus (LSN) in the ipsilateral (left) and contralateral (right) spinal cord following injection with AAV9 (top), AAV2retro (middle), or Fast-DiI (bottom) (** p<0.01, **** p<0.0001, compared to Fast-DiI; $ $ p<0.01, compared to AAV2r). The total number of labeled neurons analyzed and the number of animals (n) is noted under the stacked bars. Pie charts in D show the percentage of labeled neurons present in lamina I-V of DH. Proportions of labeled neurons in spinal laminae were compared using Two-way ANOVA and Bonferroni posttest ($, p<0.05 compared to AAV2r). E, The average labeling of spinal tracts at the level of L3 is shaded for AAV9 (E1) and AAV2r (E2). F, Retrograde labeling of cortical neurons in primary motor cortex (M1) following parabrachial injection of AAV2retro; scale bar = 150μm.

